
Yesterday’s nonfarm payroll employment growth (here) surprised (significantly) on the downside.

Figure 1: Nonfarm payroll employment from July release (blue), August (red), September (teal), October (pink), November (lilac), December (black), December consensus calculated adding Bloomberg consensus of 1/6 to November preliminary (light gray +), all in 000’s, s.a. Source: BLS, Bloomberg, author’s calculations.
The downside surprise is all the more surprising given the ADP for private nonfarm payroll employment.
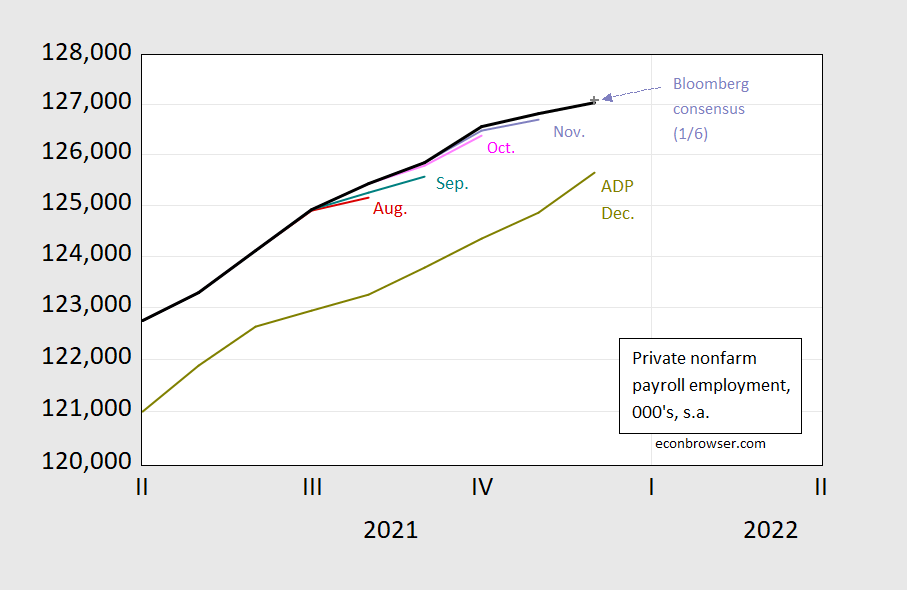
Figure 2: Private nonfarm payroll employment from August release (red), September (teal), October (pink), November (lilac), December (black), December consensus calculated adding Bloomberg consensus of 1/6 to November preliminary (light gray +), ADP (chartreuse), all in 000’s, s.a. Source: BLS, Bloomberg, author’s calculations.
Private NFP looks only slightly below consensus because I calculate the consensus level by adding the consensus change to November initial release level, and November’s figure was raised up. The consistent upward revisions over the past months suggests the December figure will similarly be upward revised.
Other indicators of labor market overall development rose faster: aggregate weekly hours (for private nonfarm production/non-supervisory workers) and civilian employment rose
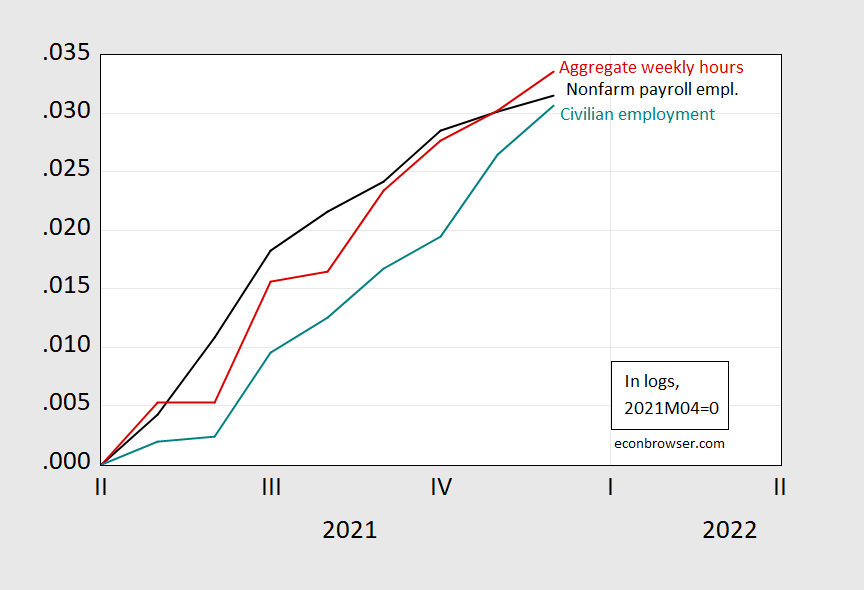
Figure 3: Nonfarm payroll employment from December release (black), aggregate weekly hours (red), civilian employment (teal), in logs, 2021M04=0. Source: BLS and author’s calculations.
While civilian employment has risen faster in growth rates and numbers (0.42% vs 0.13%, 651K vs. 199K), as noted previously, it’s not justified to put much weight on this series vs. the establishment based series [1]. This point was reinforced in a just circulated paper by Goto, Jacobs, Sinclair, van Norden. See Furman and Powell for more.


Comments
Log in or sign up to join the conversation.