
DAX30 CFD
The DAX went parabolic over the last week of trading, gaining further bullish momentum after the German index recaptured the SMA(200) around 12,000/050 points.
At first glance, it seemed quite optimistic to get to see a walk-through on the upside with a push as high as the region around the January lows around 12,850/900 points.
But, despite social unrest in the US, a still very dark fundamental picture for the US economy, but also for the European economy, the combination of the EU commission proposal of a 750 Billion-Euro fiscal stimulus package with 500 billion Euro in grants and 250 billion in loans for European Union regions which can be considered a first step toward a transfer union, the German governing coalition agreeing on an additional €130bn economic stimulus package which will see e.g. value-added tax rate cut from 19% to 16% and an ECB which boosted the size of its PEPP program on Thursday to 1.35 trillion Euros with being set to run through at least the end of June 2021, the DAX30 took off on the upside.
While the stock market has obviously completely decoupled from the real economy and with the German index seeing a valuation at a Price-Earnings-Ratio of around 20, its highest level since the New Economy at 2000, the bullish performance is also a warning sign for 'bears'.
Whatever driver the DAX30 currently finds, it is a clear bullish one and further gains with a first target being found around the January lows between 12,850/900 points seem likely.
A corrective move finds a potential first support around 11,850/900 points, a deeper correction could see a re-test of the region around 11,450/500.
Technically, on a daily time-frame, as long as we trade above 10,300 points, the mode stays bullish on D1:
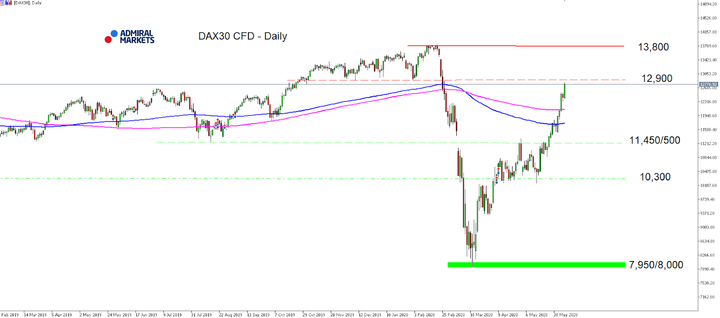
Source: Admiral Markets MT5 with MT5-SE Add-on DAX30 CFD Daily chart (between February 20, 2019, to June 5, 2020). Accessed: June 5, 2020, at 10:00pm GMT - Please note: Past performance is not a reliable indicator of future results, or future performance.
In 2015, the value of the DAX30 CFD increased by 9.56%, in 2016, it increased by 6.87%, in 2017, it increased by 12.51%, in 2018, it fell by 18.26%, in 2019, it increased by 26.44% meaning that after five years, it was up by 34.2%.
US Dollar
The picture in the US dollar hasn't significantly changed over the last week of trading again.
In fact, the Greenback stayed under pressure after the Euro, which has a weight of 58% in the USD Index Future basket, took on further bullish momentum after further hopes on an EU transfer union materialised with the EU commission having proposed a 750 Billion-Euro fiscal stimulus package with 500 billion Euro in grants and 250 billion in loans on May 27.
But while the deep push below 100.00 points in the USD Index Futures can short-term be interpreted as bearish, the technical picture in the USD Index Future stays overall neutral between 94.00 and 104.00 points.
Still, our expectation of a further "liquidity boost" from the Fed which has pushed its balance sheet above the 7 trillion mark last week, could rather sooner than later result in a sustainable drop in 10-year US Treasury yields below 0.60, levelling the path for a deeper push below the 100.00 point mark and meaning further USD weakness against the Euro, but also against the GBP or JPY:
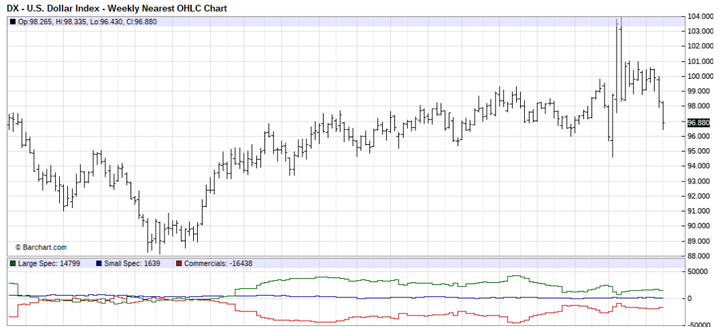
Source: Barchart - U.S Dollar Index - Weekly Nearest OHLC Chart (between July 2017 to June 2020). Accessed: June 5, 2020, at 10:00pm GMT
Euro
In our last weekly market outlook we wrote:
[…]The sustainable break above 1.1000 levels the path up to 1.1200 and probably even higher in the months to come[…]
and last week we saw exactly that with the EURUSD pushing to its highest levels since the end of March.
The main driver was still the EU commission's proposal of a 750 Billion-Euro fiscal stimulus package with 500 billion Euro in grants and 250 billion in loans and in addition the ECB which boosted the size of its PEPP program last Thursday to 1.35 trillion Euros with being set to run through at least the end of June 2021.
While this first step toward a transfer union stays a bullish driver for the Euro in the weeks ahead, most of this short-term positiveness might be priced in by now, even though further gains, probably as high as 1.1400/50 and thus a test of the current yearly highs, still seem an option.
Such a run could be seen if we get to see in addition a sustainable drop in 10-year US Treasury yields below 0.60% which would narrow the yield differential between EU and US bonds further, favouring gains in the EUR/USD.
On the other hand: a corrective move finds a solid support and potential Long-trigger around 1.1000, the breakout region:
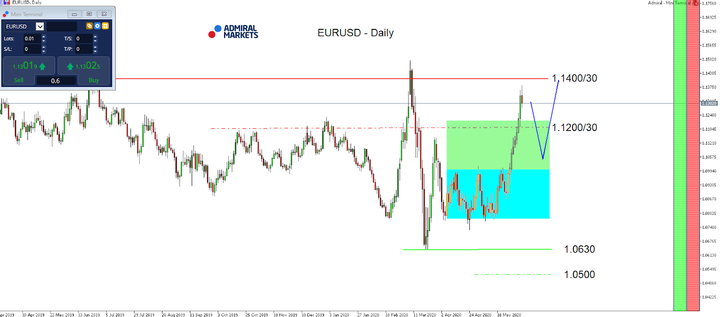
Source: Admiral Markets MT5 with MT5-SE Add-on EUR/USD Daily chart (between April 8, 2019, to June 5, 2020). Accessed: June 5, 2020, at 10:00pm GMT - Please note: Past performance is not a reliable indicator of future results, or future performance.
In 2015, the value of the EUR/USD fell by 10.2%, in 2016, it fell by 3.2%, in 2017, it increased by 13.92%, 2018, it fell by 4.4%, 2019, it fell by 2.2%, meaning that after five years, it was down by 7.3%.
JPY
JPY surprised with weakness over the last week of trading, the USD/JPY took on bullish momentum and went for a re-test of the region around 109.00.
In fact, no real news was available which could have acted as a driver for the bearish JPY performance, making it difficult to consider the move to be sustainable.
But while we stay sceptical for the USD/JPY and keep our overall bearish outlook on the currency pair, we remain cautious in regards to the USD/JPY short-engagements, recapturing 109.50 could indeed level the path up to and above 110.00 again.
But even such a move higher should be questioned in our opinion: our expectation of a further "liquidity boost" from the Fed which has pushed its balance sheet above the 7 trillion mark last week, could rather sooner than later result in a sustainable drop in 10-year US Treasury yields below 0.60, levelling the path for a push lower in the USD/JPY, too.
That said, a test of the region around 105.00 and even a push lower seems a realistic option in the days and weeks to come in the USD/JPY, at least as long as the currency pair does not recapture 109.00/50:
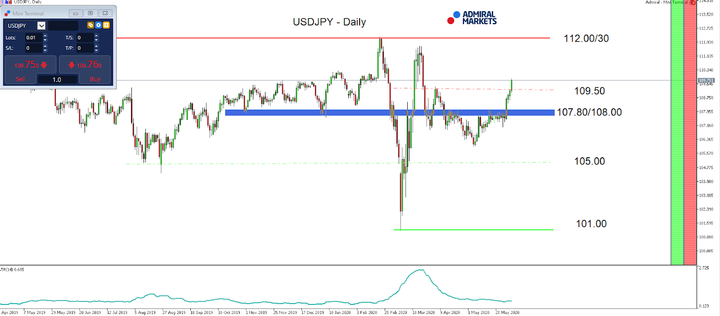
Source: Admiral Markets MT5 with MT5-SE Add-on USD/JPY Daily chart (between April 15, 2019, to June 5, 2020). Accessed: June 5, 2020, at 10:00pm GMT
In 2015, the value of the USD/JPY increased by 0.5%, in 2016, it fell by 2.8%, in 2017, it fell by 3.6%, in 2018, it fell by 2.7%, in 2019, it fell by 0.85%, meaning that after five years, it was down by 9.2%.
Gold
Our take for Gold hasn't changed over the last week of trading -despite the weak weekly close with the massive surprise from the US labour market last Friday.
As a result, the yellow metal dropped below 1,700 USD and went for an attack of the region around 1,660 USD. Still, we remain mid-term clearly bullish for Gold.
One potential reason for the 'big' NFP number is how jobs were calculated and thanks to the massive PPP loan/grants, numbers beat expectations as they did, even though critics will certainly argue that PPP funded jobs should not be counted as "jobs added" to the private sector data.
However, technically the bearish divergence in the RSI(14) on a daily time-frame plays out now, resulting in a test of the short-term trend-support around 1,660 USD.
Still, as long as we don't get to see a sustainable break lower, our take for the yellow metal stays clearly bullish and we expect rather than later a stint to the all-time high around 1,920 USD.
One potential driver for such a move could be a sustainable drop in 10-year US Treasury yields below 0.60% which seems, in our opinion, only a question of time.
The reason here can be found in our expectation of a further "liquidity boost" from the Fed which has pushed its balance sheet above the 7 trillion mark last week and should rather sooner than later result in a further drop in US yields:
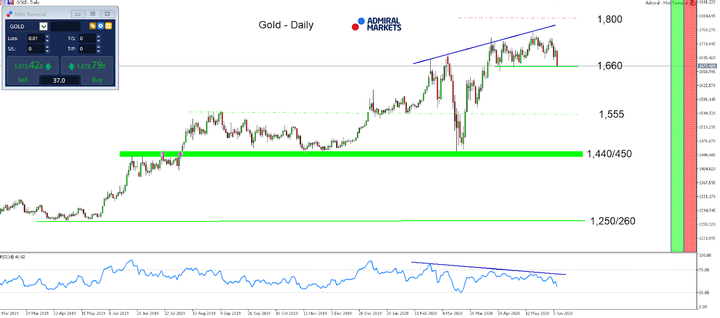
Source: Admiral Markets MT5 with MT5-SE Add-on Gold Daily chart (between March 7, 2019, to June 5, 2020). Accessed: June 5, 2020, at 10:00pm GMT - Please note: Past performance is not a reliable indicator of future results, or future performance.
In 2015, the value of Gold fell by 10.4%, in 2016, it increased by 8.1%, in 2017, it increased by 13.1%, in 2018, it fell by 1.6%, in 2019, it increased by 18.9%, meaning that after five years, it was up by 28%.


Comments
Log in or sign up to join the conversation.