


Markets are ending the week with the worst possible pairing: an AI de-rating and an oil shock. The technology selloff has gathered pace as investors question whether the returns on AI capex can justify the spending surge, while Brent’s move through $100/bbl has revived the inflation scare and pushed central-bank pricing back in a hawkish direction. The result is a classic stagflation-flavoured tape: equities weaker, duration under pressure, and policymakers with less room to look through the noise.
The MSCI Asia Pacific Index fell 2.2%, following the S&P 500’s steepest one-day decline in a month. The damage was concentrated in the same names that had led the rebound earlier in the week. Samsung (SSNLF) and SK Hynix (HXSCL) both dropped more than 7%, while Nasdaq 100 futures pointed to further losses after the US tech selloff. The AI trade has not lost its long-term story, but it has clearly lost the market’s willingness to ignore near-term cash-flow, margin and valuation questions. This week’s earnings have sharpened that concern. Alphabet’s (GOOGL) higher-than-expected capex number reminded investors that AI is not free money for the platforms: it is a massive investment cycle whose returns are still being proven. That is good for parts of the semiconductor supply chain when sentiment is supportive, but it becomes more ambiguous when rates rise and investors start asking whether the spending creates enough incremental revenue to justify the hit to free cash flow.
The problem today is that the macro backdrop is no longer helping. Brent crude is hovering around $100/bbl after briefly breaking above that level, following Thursday’s more than 5% advance. Oil is now up nearly 38% this month, a move large enough to overwhelm the comfort from last week’s softer US CPI and PPI prints. The disinflation narrative has not disappeared, but it is being dragged back into court by the energy market. Middle East risk remains the core driver. Trump’s threat of a “massive attack” on Iran, alongside warnings of “major military punishment” for the Houthis after attacks on Saudi tankers in the Bab el-Mandeb Strait, has left risk sentiment firmly on the back foot. The geography matters: markets are no longer just pricing Hormuz risk, but a broader disruption threat across key maritime chokepoints. That raises the risk premium through crude, refined products, shipping, insurance and inflation expectations.
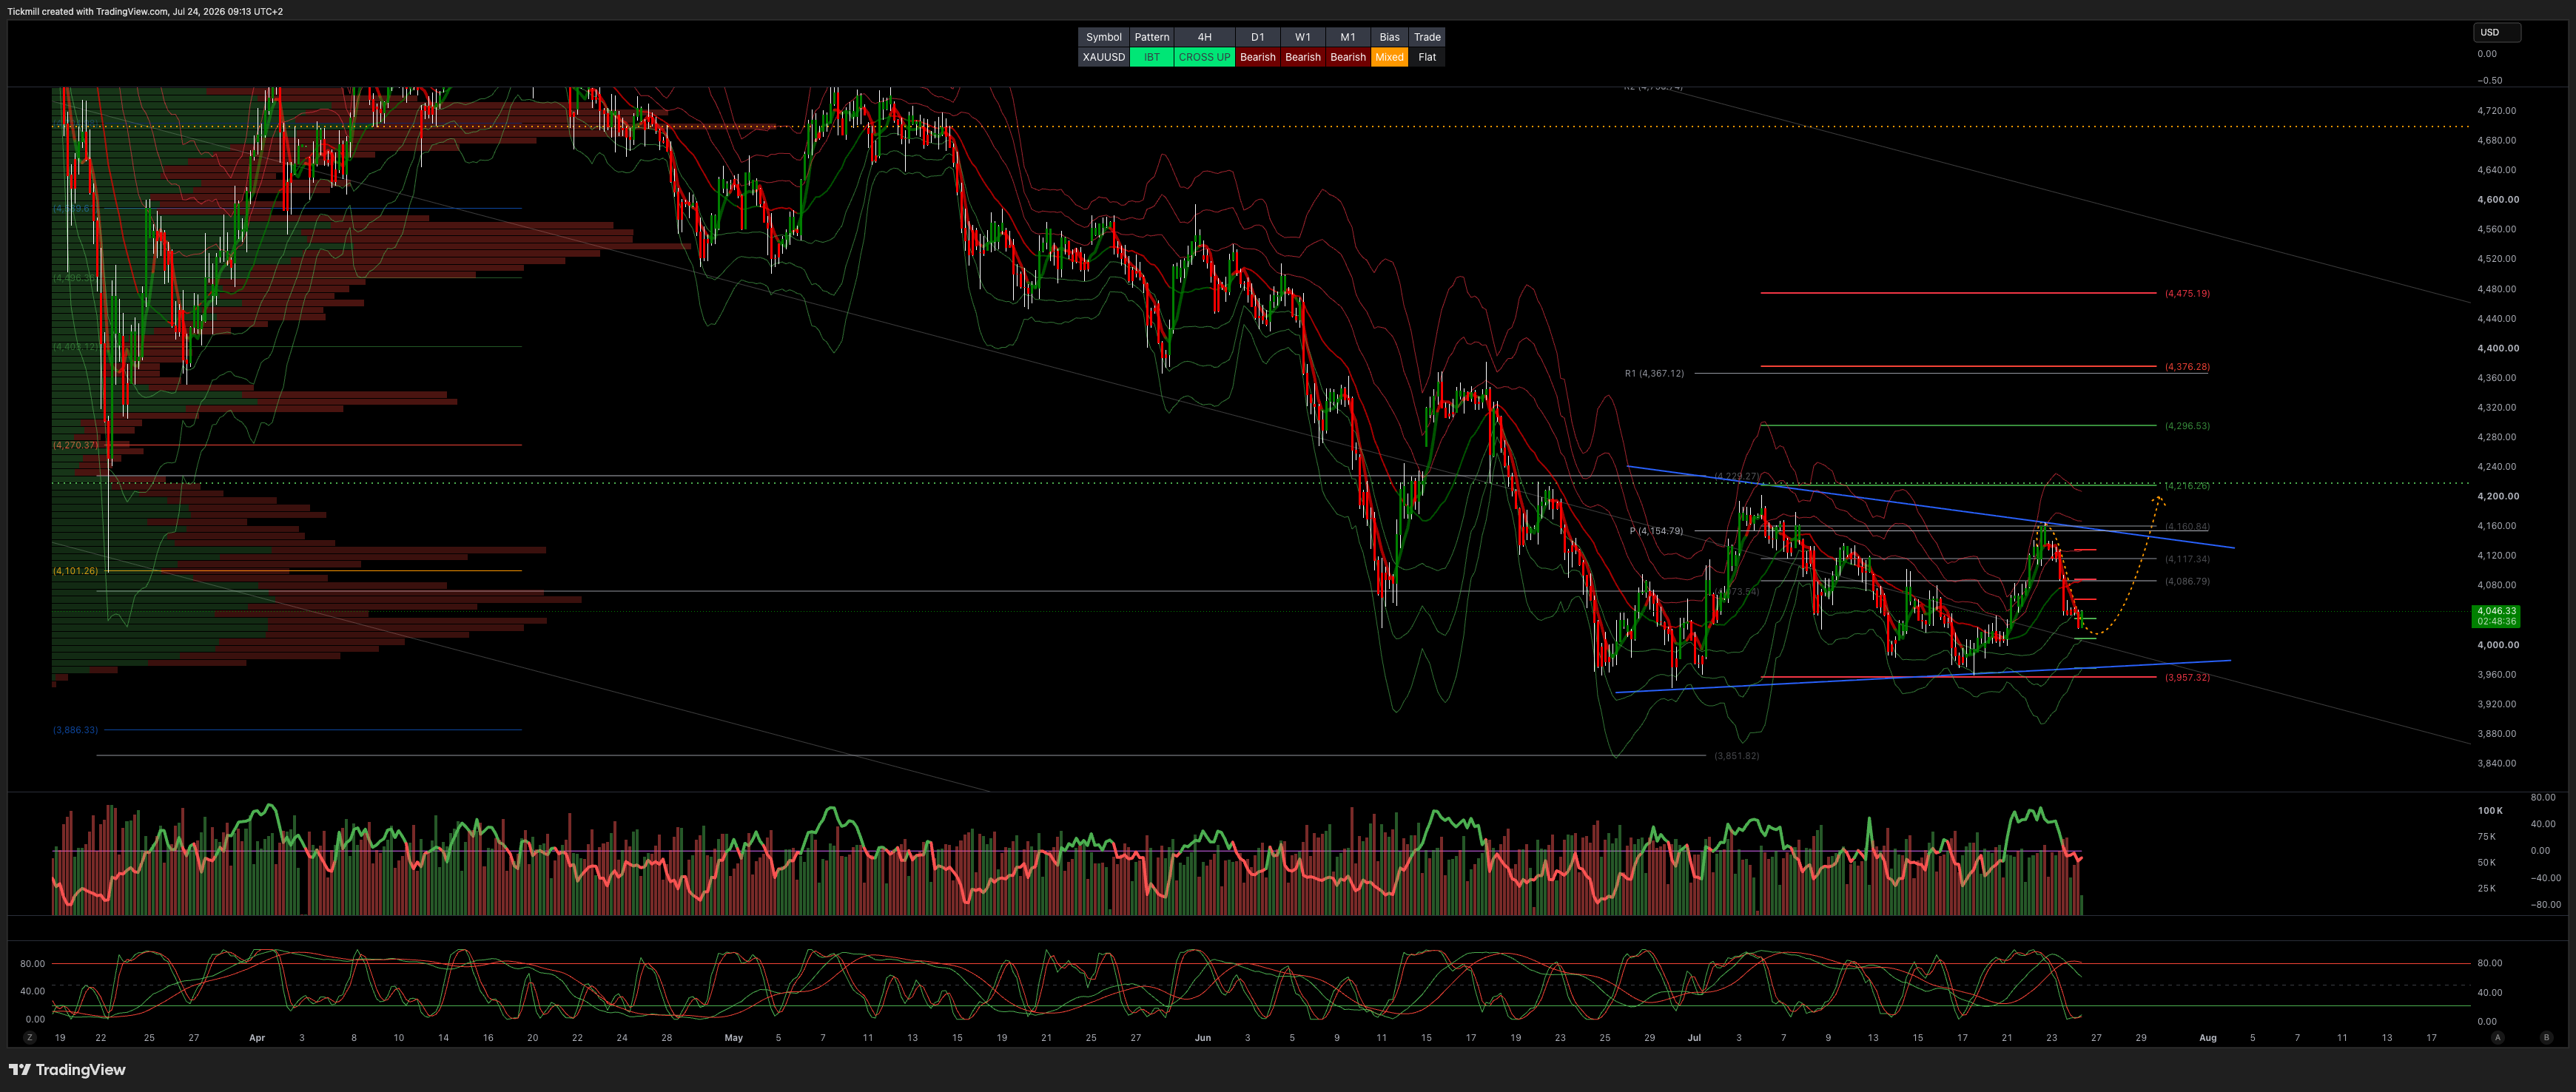
Bond markets are feeling the pressure, even if the overnight move has been more orderly than the equity selloff. The 10-year Treasury yield is around 4.70%–4.71%, while government debt in Japan, Australia and New Zealand also weakened. Higher oil is forcing investors to mark up the probability that central banks keep policy restrictive for longer, or tighten again if the energy shock feeds into expectations and wages. Gold’s reaction is also telling. Despite the geopolitical backdrop, gold slipped toward $4,025/oz as higher yields reduced the appeal of non-yielding assets. That says this is not a clean haven trade. It is an inflation-and-rates shock in which traditional hedges are competing with the gravitational pull of higher real yields.
The US also added a fresh trade shock. New tariffs of 10% to 12.5% will apply almost immediately to around 60 nations, including the UK and euro area, following a US assessment of forced labour in supply chains. The contours of this policy were partly anticipated as a route to rebuild parts of the tariff regime previously struck down by the Supreme Court, but the timing is unhelpful. Tariffs are another upside inflation risk landing just as energy prices surge.That leaves the Fed in a difficult position. Softer June CPI still supports another unchanged decision next week, with rates likely held at 3.50%–3.75%. But the broader backdrop is no longer dovish. Demand data remain firm, labour participation has softened, spare capacity looks less comfortable, financial conditions are not tight, and oil has taken another leg higher. Market pricing already reflects the risk: September is now priced with roughly an 80% chance of a hike. Chair Warsh is unlikely to offer much clean guidance. His communication style has deliberately reduced reliance on explicit forward signals, and next week’s press conference may focus more on the Fed’s task forces than on precommitting to the next move. The base case remains that the Fed tightens again this year and that the cycle extends into next year as inflation pressures persist. The main question is timing. If energy takes a second bite before the midterms, the Fed may not be able to wait.
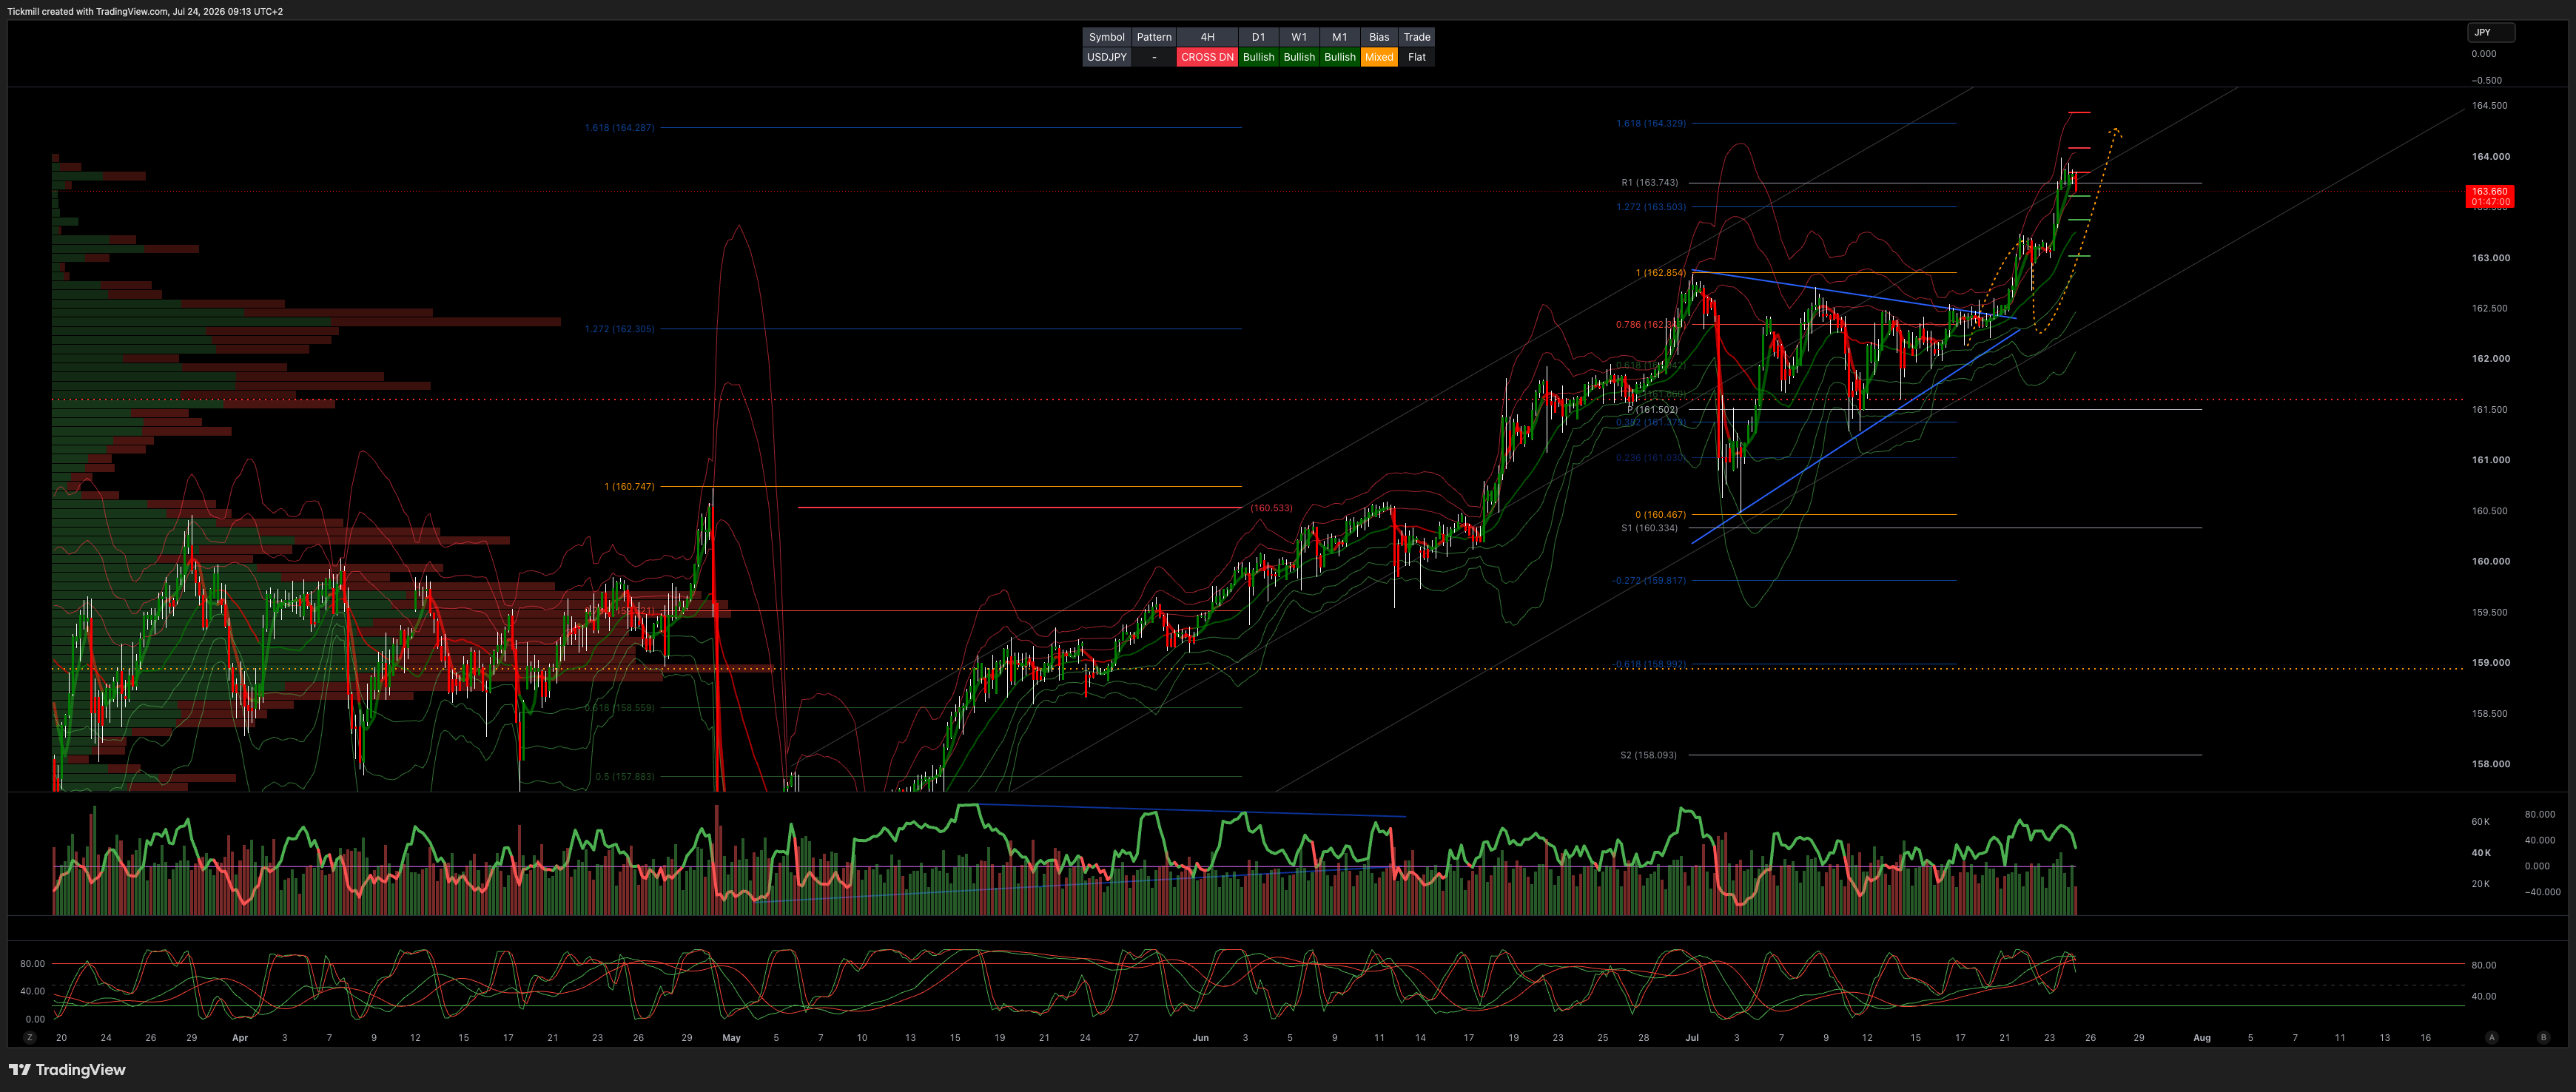
Japan remains one of the more fragile pressure points. June CPI rose to 1.7% y/y, up 0.2ppts from May, while the composite flash July PMI firmed slightly to 53.1 from 52.8. That is not a crisis signal, but it does show an economy still expanding while import costs rise. Meanwhile, USD/JPY is hovering just below 164, keeping intervention risk live and reinforcing the sense that the BoJ is behind the curve. The BoJ is expected to hold rates at 1.0% next week, and markets price only one hike by year-end. That looks increasingly uncomfortable. Yen weakness, a steepening JGB curve and rising oil/import costs all point toward pressure building beneath the surface. Officials have hinted that tightening may need to happen more frequently than every six months, which is another way of admitting that the current pace may not be enough. Governor Ueda’s return after missing the last meeting due to illness should give markets a clearer read on whether the BoJ is ready to shift the internal debate more hawkishly, especially with the Q3 forecasts available. The euro area message is more straightforward after yesterday’s ECB meeting and subsequent sources story. Lagarde and Nagel both emphasised the data still to come before September, but the traditional post-meeting sources line validated market expectations that a September hike is likely. That is not surprising. Brent near $100/bbl, tariffs, and renewed geopolitical escalation make it difficult for the ECB to push back against a market already leaning hawkish.
The UK’s domestic data are more nuanced. Consumer confidence recovered to -17 in July from -23 in June, returning to its pre-Middle East-conflict level. Good weather, England’s World Cup run and a possible “Burnham bounce” likely helped. The problem is durability. If higher fuel prices feed through into household bills and visible pump costs, it is hard to see that confidence improvement surviving intact next month. June retail sales were strikingly strong on the headline. Volumes rose 4.2% y/y including fuel, well above expectations of 2.4%, while ex-fuel volumes rose 5.4% y/y versus expectations of 3.2%. Good weather boosted demand across several categories, but the more important detail was discounting. The ONS repeatedly referenced price cuts, and the deflator data show ex-fuel retail inflation easing to 1.6% y/y in June from 2.1% in May and 3.0% in April. That matters for the BoE because it suggests some firms are absorbing cost pressure through margins rather than passing everything through to consumers. Volumes are clearly price-sensitive, and fuel sales were down 7.6% y/y, despite fuel usually being relatively inelastic. In policy terms, the strong sales headlines cannot be dismissed, but the composition is less inflationary than it first appears. Demand is holding up partly because retailers are discounting.
The BoE therefore looks more comfortable than the Fed or BoJ, but not comfortable in an absolute sense. Short rates have already tightened UK financial conditions meaningfully, credit growth has responded, and CPI has surprised to the downside for three consecutive reports. Food inflation has also undershot sharply, which is important given its role in inflation expectations. Those factors support a hold at 3.75% next week. But the Bank still has a communication problem. Underlying inflation is too high, services remain sticky, producer cost pressures are rising, and the energy shock feeds into UK bills with a lag. Natural gas and refined products are moving back toward highs, which means the inflation shock is not over. Bailey can argue for looking through external energy pressure, but he cannot sound relaxed about it. The UK fiscal backdrop adds another layer. The new government’s early announcements may be individually small, but the pattern has reduced market visibility. Electricity VAT relief, bus fare support and hospitality rates cuts are not large enough on their own to destabilise gilts, but repeated commitments without full funding detail leave investors wondering how long the sequence will continue. In a world of higher oil and higher global yields, fiscal ambiguity carries a bigger price.
Friday’s market message: the market is no longer trading a simple AI correction or a simple oil shock. It is trading both at once. Tech is being forced to prove the return on AI spending just as Brent above $100/bbl revives inflation risk and pushes central banks back toward hawkishness. The Fed can probably hold next week, the BoE can still justify patience, and the ECB can wait until September. But the direction of travel is clear: higher energy has made every central bank’s job harder, and higher rates have made every AI valuation harder to defend.
Overnight Headlines
Trump "Close" To Decision On "Massive Attack" On Iran
Trump Says Iran Will Be Held Responsible For Future Houthi Attacks
Trump Unveils New Tariffs Designed To Withstand Legal Scrutiny
Senate Preparing To Vote On Russia Sanctions Next Week
Carney Says ‘Everything’s On The Table’ If US Imposes New 50% Tariffs
UK Consumer Confidence Jumps Amid ‘Burnham Bounce’
Japan Inflation Picks Up In June, Keeping Rate Increases On Track
OPEC+ Likely To Again Raise Oil Output Targets From September
Intel (INTC) Shares Rise As Sales Surge 25% In Second Quarter
SAP (SAP) Cloud Revenue Beats Estimates as Legacy Support Nears Cutoff
GE Healthcare (GEHC) CFO To Step Down; Reports Preliminary Q2 Results
Magnificent 7 Lose $797 Billion As AI Skeptics Dump Tech Stocks
Tesla (TSLA) Short Sellers Rake In $4 Billion As Shares Nosedive
US to Begin Work On New Car Door Safety Rules After Deaths In Teslas
SpaceX Is Turning Away Falcon Customers In Major Bet On Starship
Paramount (PARA)-Warner Bros. (WBD) Deal Pause Extended To Mid-August
FX Options Expiries For 10am New York Cut
(1BLN+ represents larger expiries and is more magnetic when trading within the daily ATR.)
EUR/USD: 1.1600 (EU1.76b), 1.2200 (EU1.59b), 1.2700 (EU930.7m)
USD/JPY: 162.00 ($1.95b), 160.00 ($1.57b), 163.30 ($905.3m)
AUD/USD: 0.7080 (AUD1.37b), 0.6300 (AUD1.01b), 0.6720 (AUD888.8m)
GBP/USD: 1.3405 (GBP362m)
USD/CAD: 1.4000 ($402m), 1.3950 ($399.2m), 1.4220 ($318.9m)
EUR/GBP: 0.8500 (EU414.1m), 0.8850 (EU342.2m), 0.8600 (EU300m)
USD/KRW: 1465.00 ($650m), 1505.00 ($513.3m), 1540.00 ($354.2m)
USD/CNY: 6.6900 ($300m)
CFTC Positions as of 17/7/26
Equity fund speculators have ramped up their net short positions on the S&P 500 CME, adding 6,873 contracts to reach a total of 359,456. Meanwhile, equity fund managers have reduced their net long positions in the S&P 500 CME by 30,209 contracts, bringing their total down to 941,123.
Treasury futures market, speculators have made some notable adjustments. They've trimmed their net short position in CBOT US 5-year Treasury futures by 64,833 contracts, leaving them with a total of 1,294,283. Conversely, they have increased their net short position in CBOT US 10-year Treasury futures by 17,413 contracts, now totaling 831,675. In the CBOT US 2-year Treasury futures market, there's been a significant reduction in net short positions by 103,531 contracts, bringing the total to 1,157,477.Additionally, speculators have upped their net short position in CBOT US UltraBond Treasury futures by 16,588 contracts to a total of 324,407 and have increased their net short position in CBOT US Treasury bonds futures by 35,465 contracts, reaching 179,056.
Bitcoin (BTC.X)'s net long position stands at 3,091 contracts. In the foreign exchange arena, the Swiss franc is showing a net short position of -36,956 contracts, while the British pound sits at -71,253 contracts. The euro has a net short position of -12,605 contracts and the Japanese yen is notably more bearish with a net short position of -122,663 contracts.
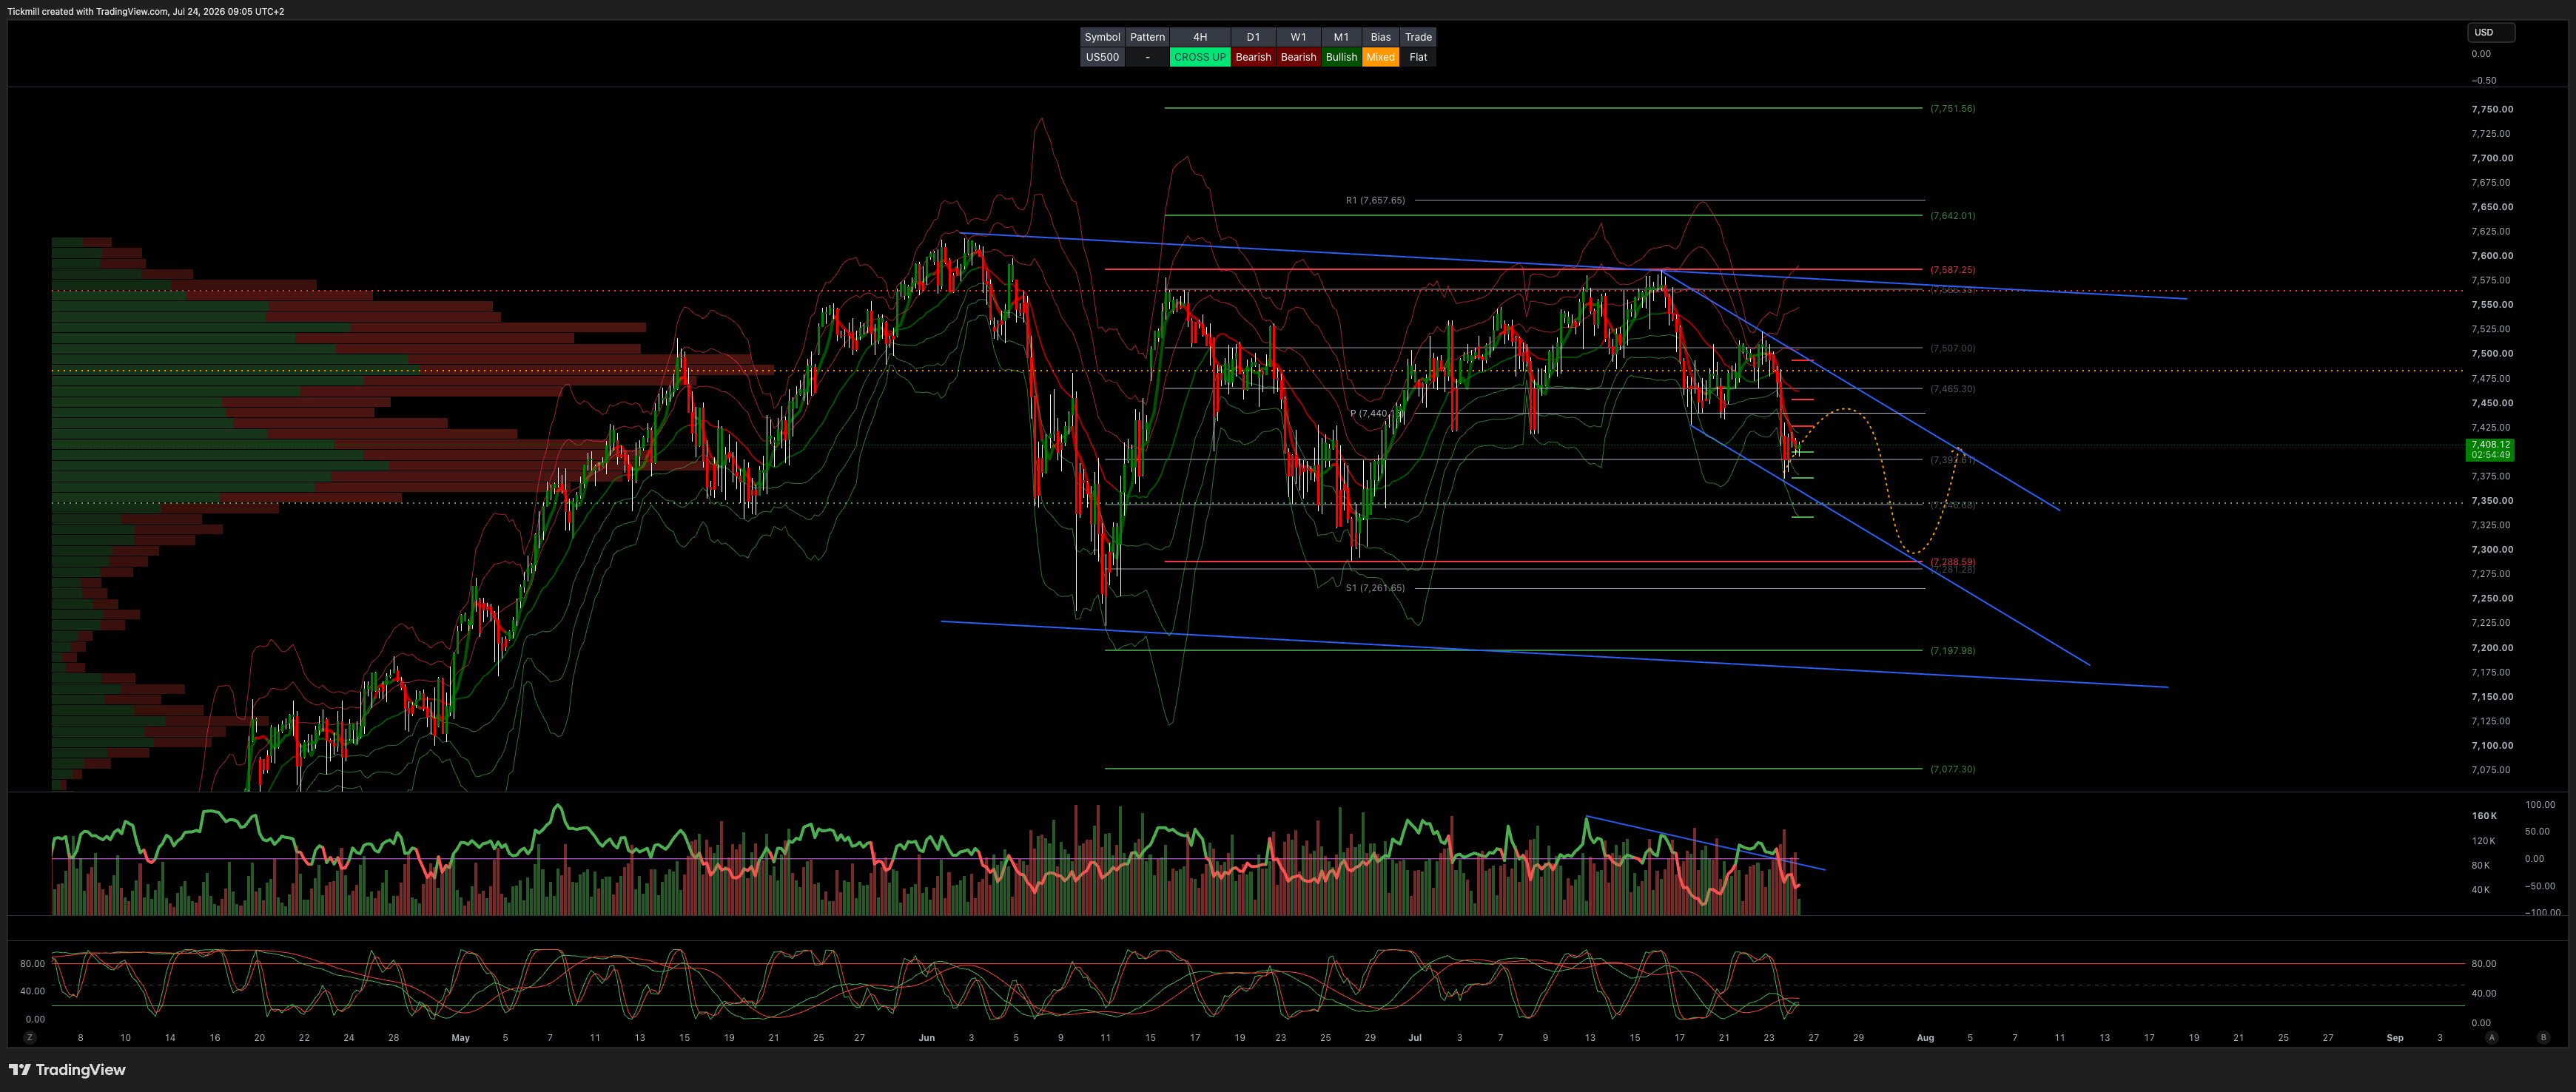
Technical & Trade Views
SP500 - 7390 weekly bull/bear level
Daily VWAP Bearish
Weekly VWAP Bearish
Above 7390 Target 7560
Below 7380 Target 7280
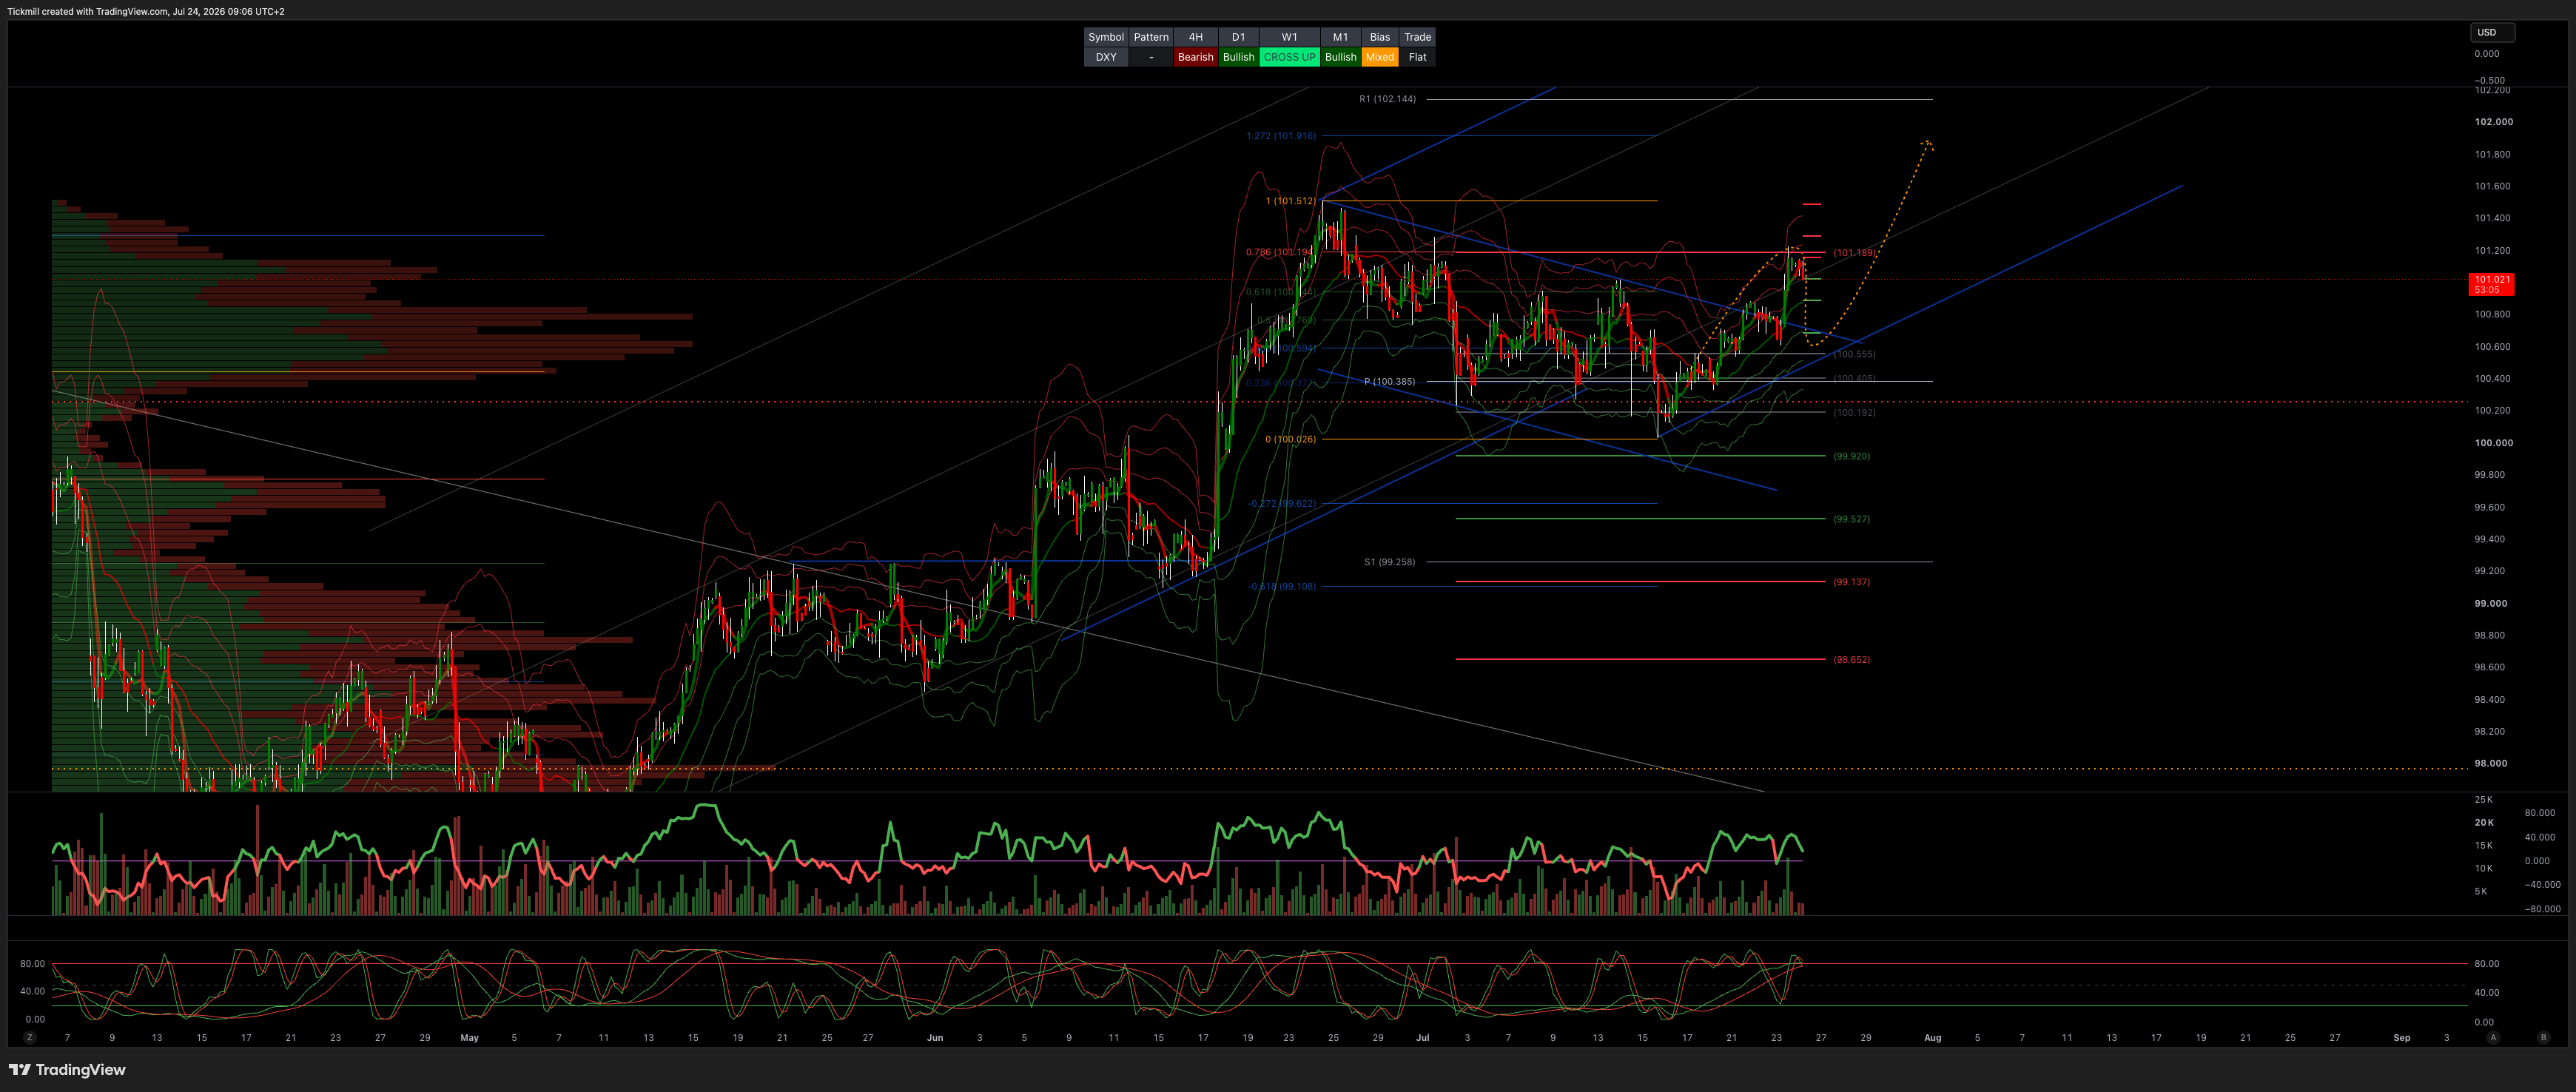
DXY - 99.75 weekly bull/bear level
Daily VWAP Bullish
Weekly VWAP Bearish>Bullish
Above 99.75 Target 102.50
Below 99.40 Target 98.40
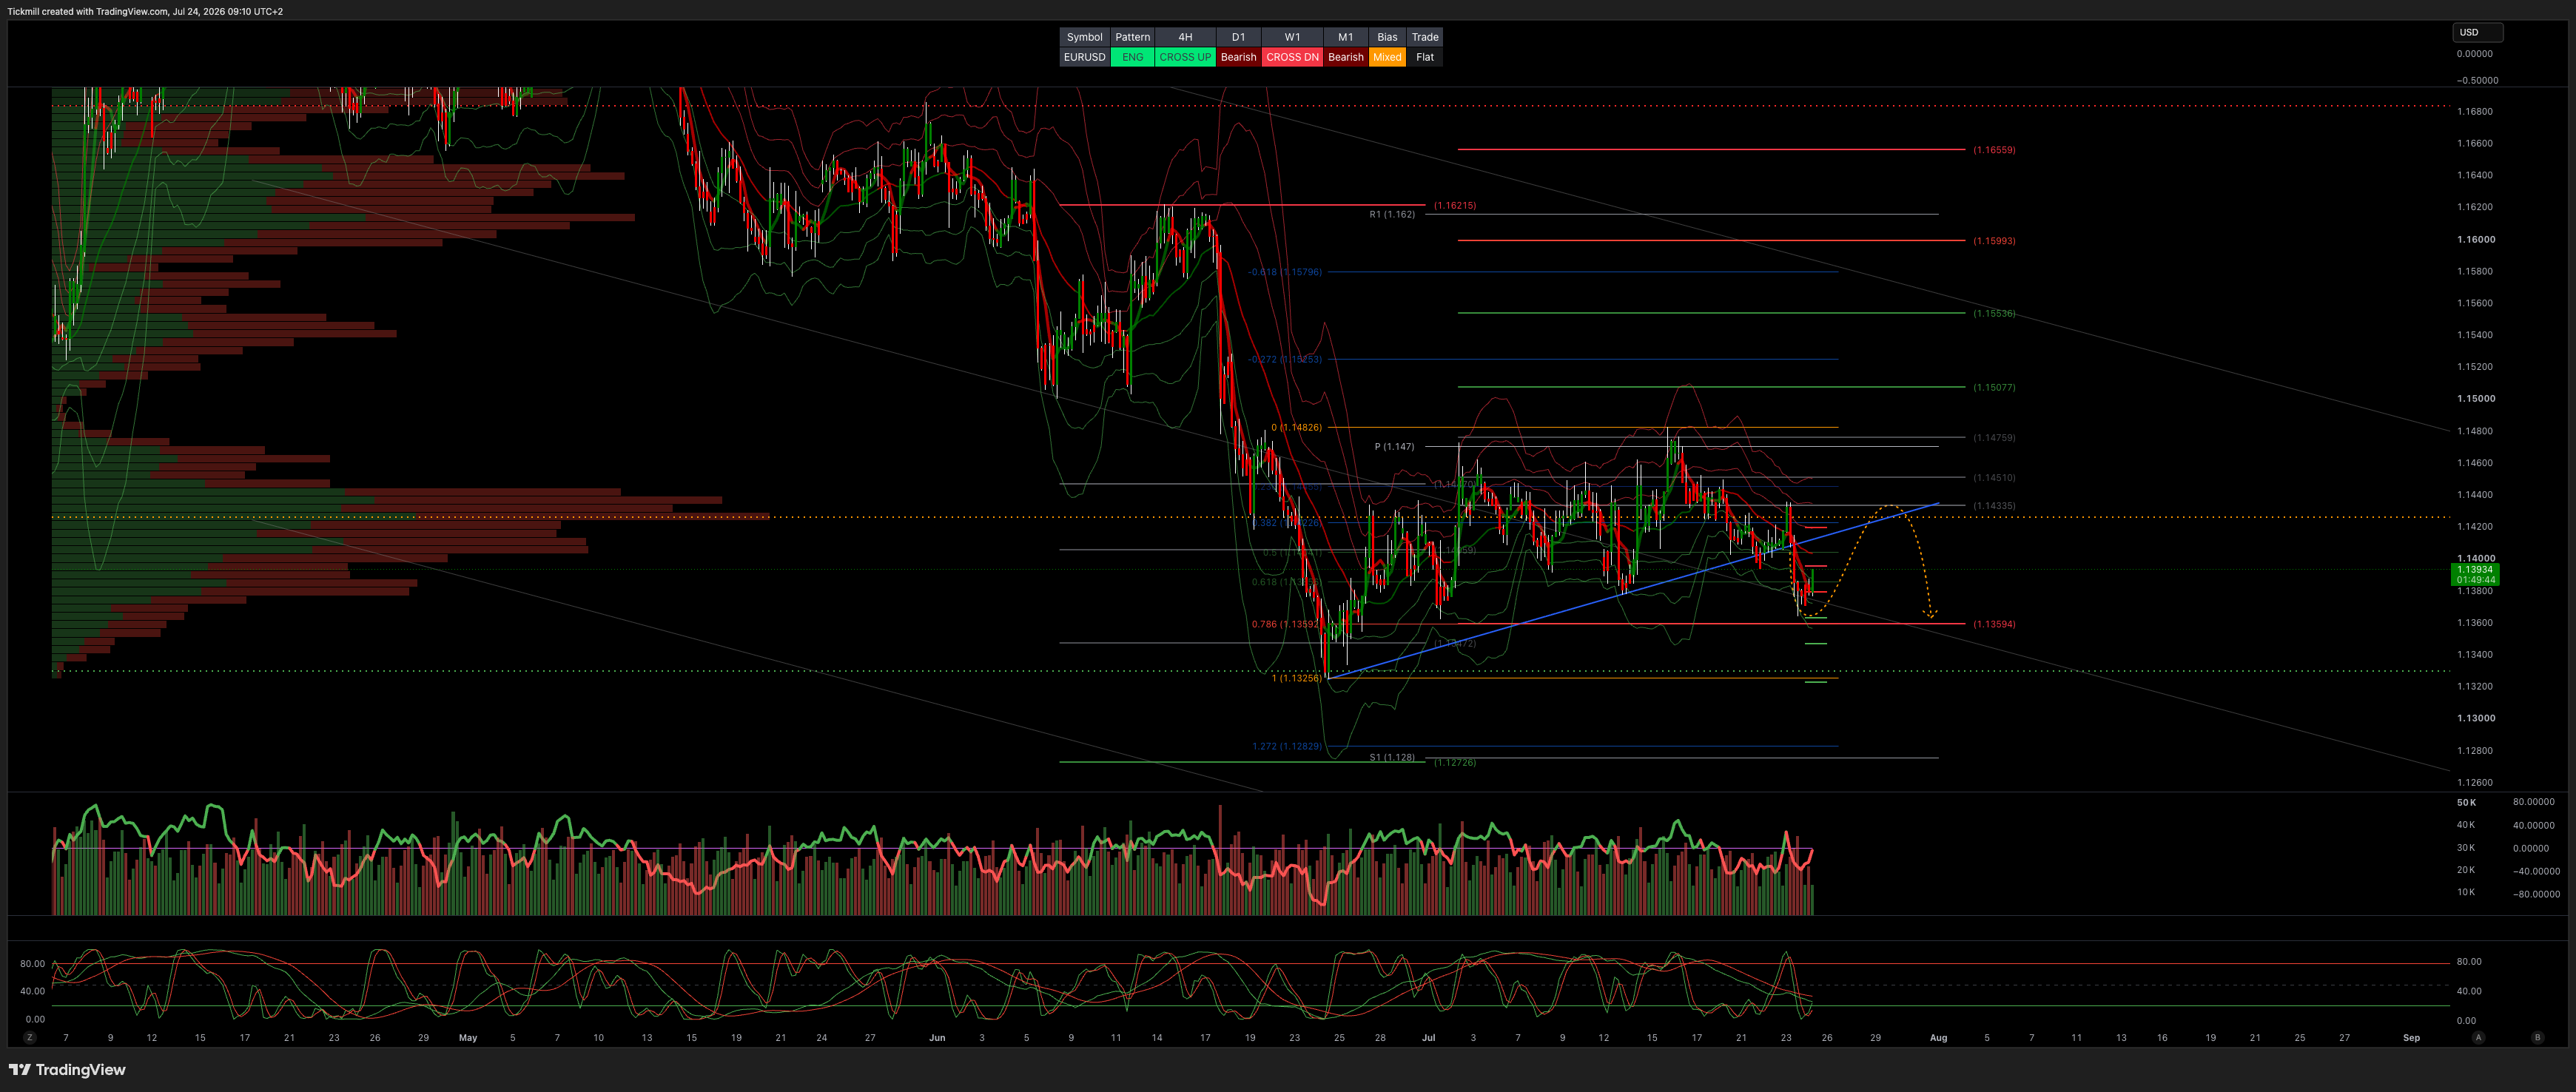
EURUSD - 1.1525 weekly bull/bear level
Daily VWAP Bearish
Weekly VWAP Bullish>Bearish
Above 1.1550 Target 1.1780
Below 1.1525 Target 1.1370
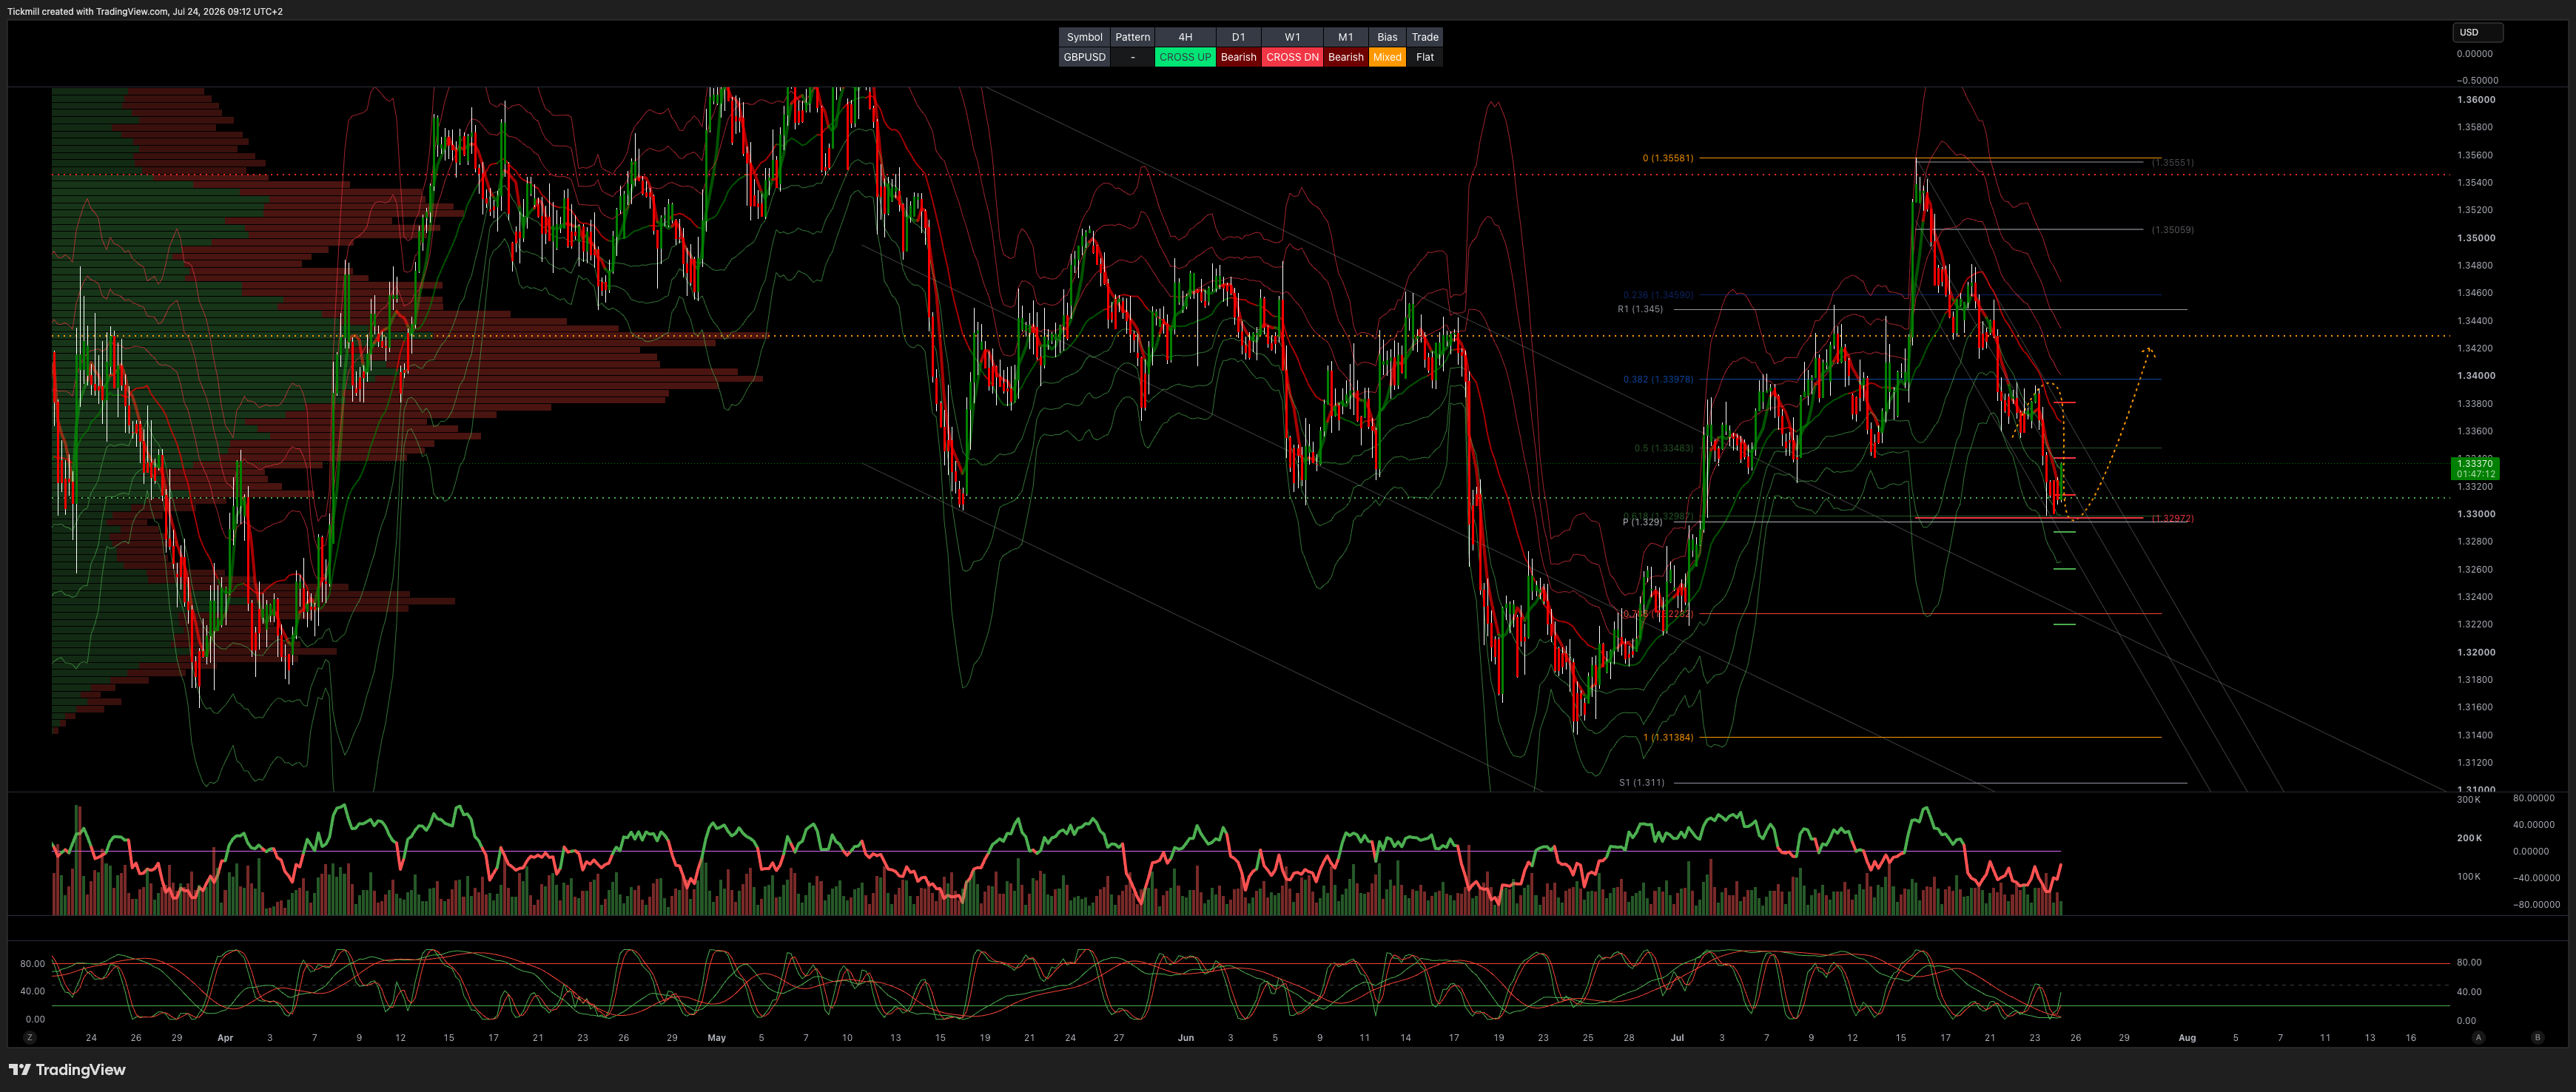
GBPUSD - 1.3450 weekly bull/bear level
Daily VWAP Bearish
Weekly VWAP Bullish>Bearish
Above 1.3450 Target 1.3640
Below 1.33 Target 1.3220
USDJPY - 161.50 weekly bull bear level
Daily VWAP Bullish
Weekly VWAP Bullish
Above 162 Target 163.75
Below 161 Target 160.50
XAUUSD - 4100 weekly bull bear level
Daily VWAP Bullish
Weekly VWAP Bearish
Above 4200 Target 4500
Below 4100 Target 3569
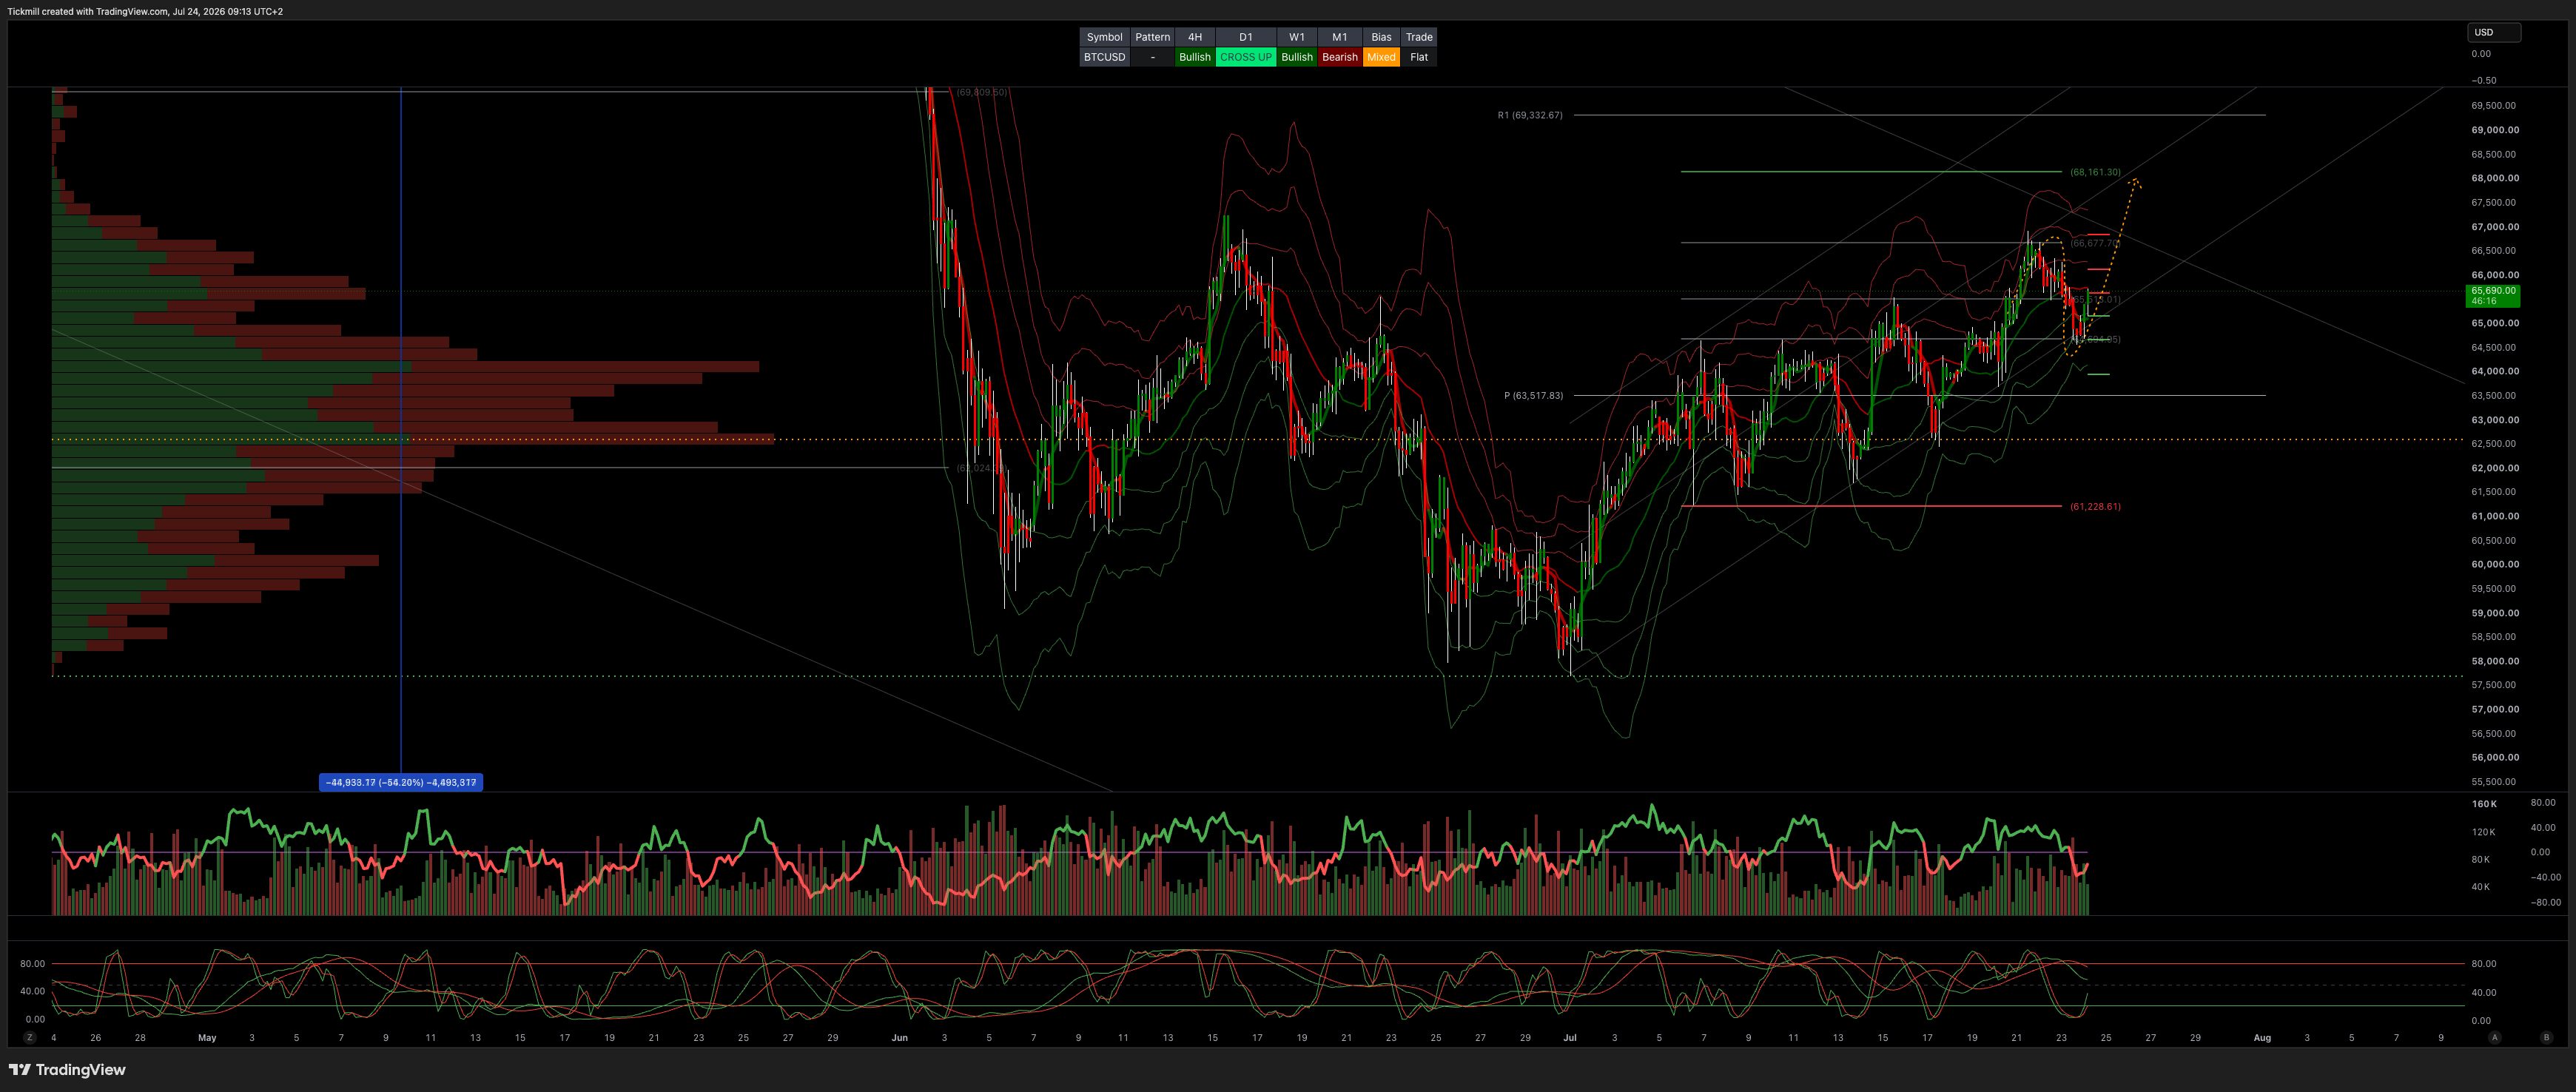
BTCUSD - 61k weekly bull bear level
Daily VWAP Bearish>Bullish
Weekly VWAP Bullish
Above 62.5k Target 68.1k
Below 61k Target 52.2k


Comments
Log in or sign up to join the conversation.