
CSX Corporation, Elliott Wave Technical Analysis
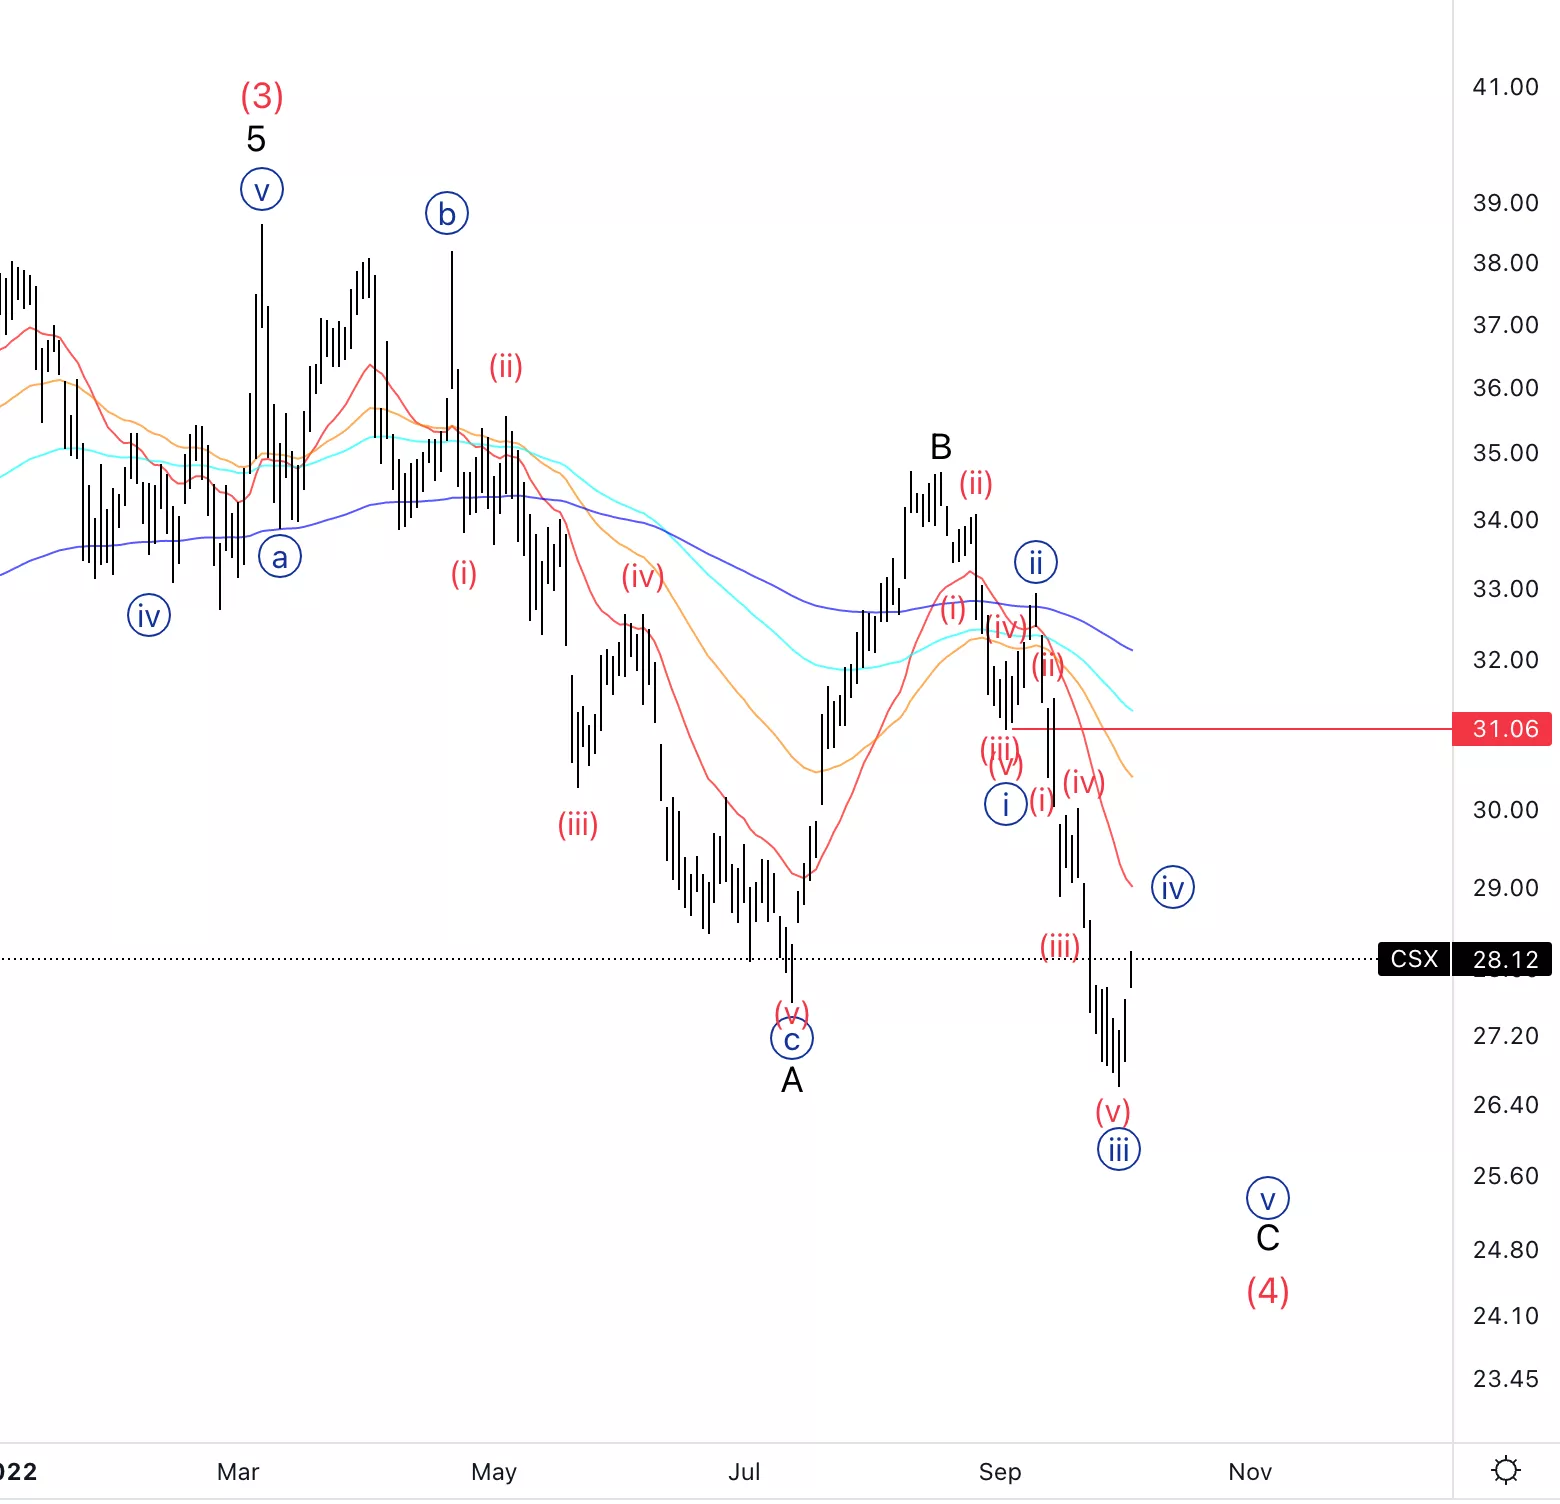
CSX Corporation, (CSX): Daily Chart, October 5 2022,
CSX Stock Market Analysis: Moving as expected, at this point we are looking to see how wave{iv} is going to unfold. Given the fact that wave {ii} was sharp I will be looking for more of a sideways correction.
CSX Elliott Wave count: {iv} of C
CSX Technical Indicators:We are below all averages
CSX Trading Strategy: Looking to short on wave {iv} ideally the 20EMA(red line) will also turn into resistance.
(Click on image to enlarge)
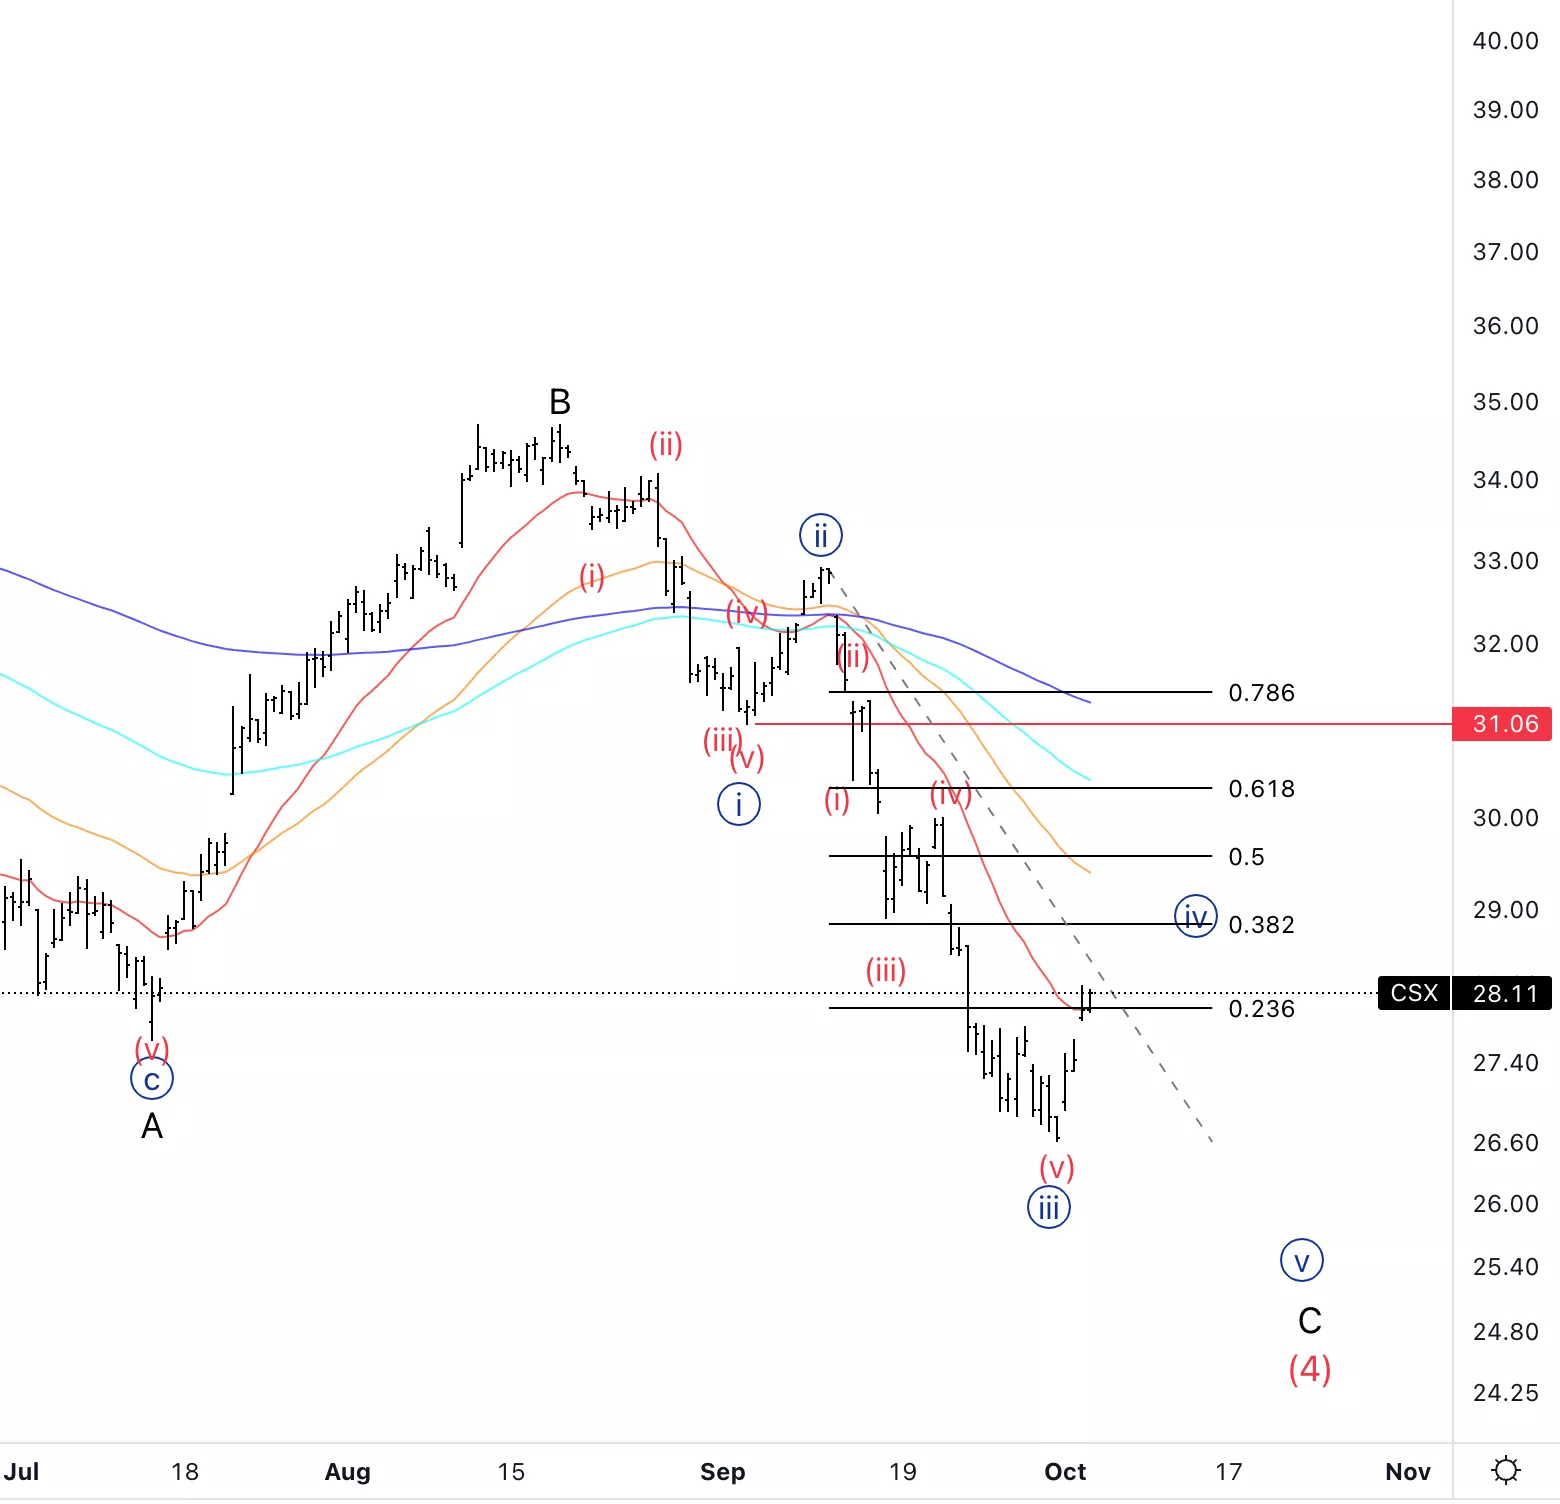
CSX Corporation, CSX: 4-hour Chart, October 5 2022
CSX Corporation, Elliott Wave Technical Analysis
CSX Stock Market Analysis: From this lower timeframe view it appears we have just started wave(a) of {c} and many times after a sharp wave (a) we fall into a sideways correction.
CSX Elliott Wave count: (a) of {iv}.
CSX Technical Indicators:We have just touch the 20EMA where we could start to pullback from.
CSX Trading Strategy: Looking for shorts from a significant Fibonacci level.
(Click on image to enlarge)
More By This Author:
DAX 40, FTSE 100, EUROSTOXX 50, Dollar, GBPUSD, EURUSD - Elliott Wave Technical Analysis
Polkadot (DOTUSD) Elliott Wave Technical Analysis 5 October 2022
Elliott Wave Analysis Of U.S. Stocks


Comments
Log in or sign up to join the conversation.