
Elliott Wave Analysis TradingLounge Daily Chart, 5 October 2022,
Polkadot (DOTUSD)
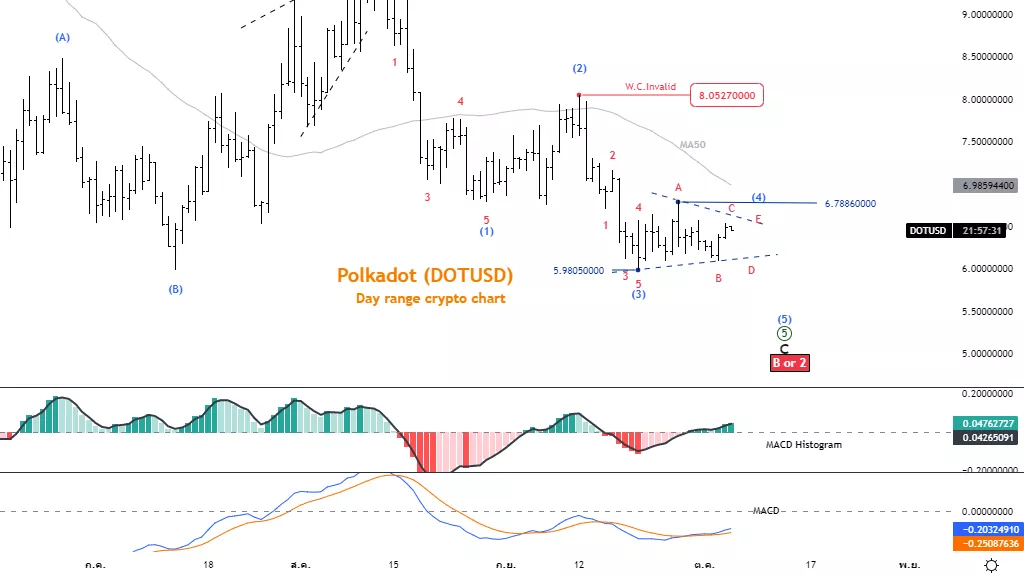
DOTUSD Elliott Wave Technical Analysis
Function: Follow trend
Mode: Motive
Structure: Impulse
Position: Wave ((5))
Direction Next higher degrees: Wave ((5)) of Motive
Details: Final decline of the fifth wave
Wave Cancel invalid level:
Polkadot (DOTUSD)Trading Strategy: Bear Market Efforts The price tends to trade below 5.98, which could be an opportunity to open a short position. but must not pullback above 6.78
Polkadot (DOTUSD)Technical Indicators: The price is below the MA200, and MASO line. momentum is bearish.
(Click on image to enlarge)
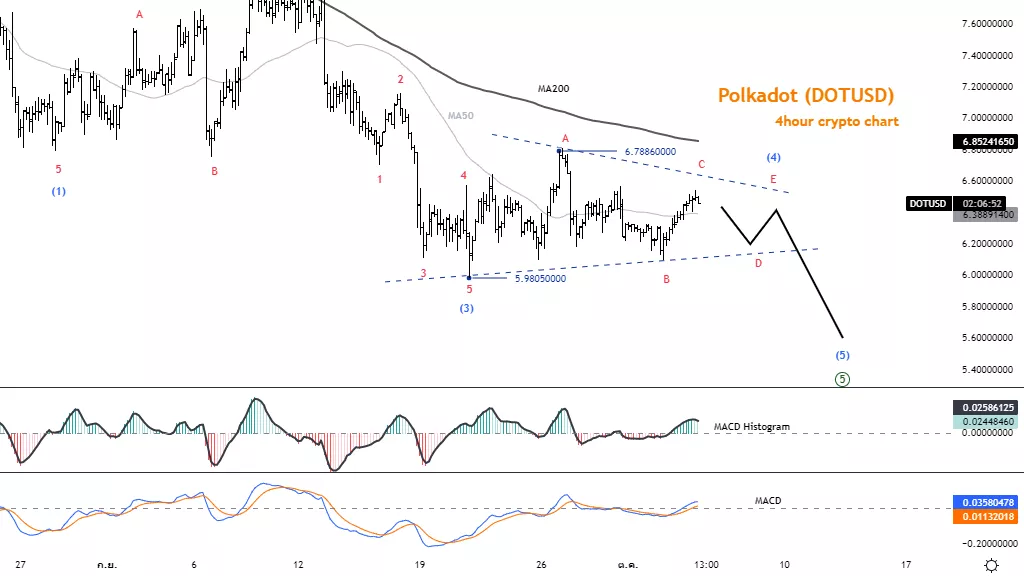
Polkadot (DOTUSD)
DOTUSD Elliott Wave Technical Analysis
Function: Follow trend
Mode: Motive
Structure: Impulse
Position: Wave ((5))
Direction Next higher degrees: Wave ((5)) of Motive
Details: Final decline of the fifth wave
Wave Cancel invalid level:
Polkadot (DOTUSD)Trading Strategy: Bear Market Efforts The price tends to trade below 5.98, which could be an opportunity to open a short position. but must not pullback above 6.78
Polkadot (DOTUSD)Technical Indicators: The price is below the MA200, and MASO line. momentum is bearish.
(Click on image to enlarge)
More By This Author:
Elliott Wave Analysis Of U.S. Stocks
Elbit Systems Ltd., Elliott Wave Technical Analysis October 4 2022
ASX200, CBA, BHP, FMG, RIO, Lithium Stocks, GDX, GOLD, NCM, DXY, AUDUSD Elliott Wave


Comments
Log in or sign up to join the conversation.