


Crypto stocks start November after an October that cost them up to 54%, more than six times Bitcoin’s drop, as Goldman Sachs data showed hedge funds sold enough AI stocks in five sessions to wipe out all their net AI buying since early 2025.
That matters for crypto because the biggest losers weren’t the exchanges. They were Bitcoin miners, which have spent two years renting their power and data centres to AI companies and now trade like AI infrastructure.
Cipher Digital (CIFR) fell 53.9% between the September 30 and October 30 closes, and IREN lost 41.4%. MARA and Riot dropped 40.2% and 36.4%. Bitcoin, tracked by BlackRock’s IBIT, fell 8.4% over the same days, and the S&P 500 barely moved.
The exchanges caught up later. Coinbase and Robinhood held up through the hedge fund selling streak, then lost 17% and 16% in the second half of the month, much of it on Friday after the Binance hack and Coinbase’s results.
So were crypto stocks sold as crypto, or as AI?
Crypto Stocks and the Hedge Fund AI Selloff: What Happened?
Hedge funds sold AI stocks for five straight sessions, from October 8 to 14, on Goldman Sachs’ prime brokerage data. Most of it was funds dumping shares they already owned, about 3.5 times the pace of new short bets, and roughly $20 billion of tech stock went out over two weeks.
The damage spread fast:
Memory chips: Samsung, SK Hynix, Micron and SanDisk lost more than $700 billion in market value in under two weeks
Hedge fund favourites: Goldman’s basket of the most-owned names fell 4.2% on October 22, its worst day since 2011
Leverage: net leverage in Goldman’s prime book fell 1.5 points to 73.3%
Goldman Delta-One head Rich Privorotsky put the problem in one line: computing demand “can grow exponentially, but the capital available to finance it cannot.”
That line describes the miners. Cipher, IREN, Hut 8, TeraWulf and Core Scientific have all signed deals to host AI computing, and IREN’s AI cloud revenue of $70.5 million overtook its Bitcoin mining revenue of $66.7 million for the first time last quarter.
The selling streak shows who traded as what. From the October 7 close to October 14:
Miners: Cipher -31.7%, IREN -21.0%, MARA -20.6%, TeraWulf -19.9%, Hut 8 -16.2%, Core Scientific -15.2%
Chip stocks (SMH): -9.6%
Coinbase: -3.1%
Bitcoin (IBIT): -2.1%
Circle: -1.6%
Every miner fell harder than chip stocks in the week hedge funds dumped AI, Cipher more than three times as hard, while Bitcoin hardly moved.
Which Crypto Stocks Fell the Most in October?
The miners, then the trading venues, then the Bitcoin holders. Over the full month, the order lines up with how much of each business looks like AI or trading volume, and how little looks like Bitcoin itself.
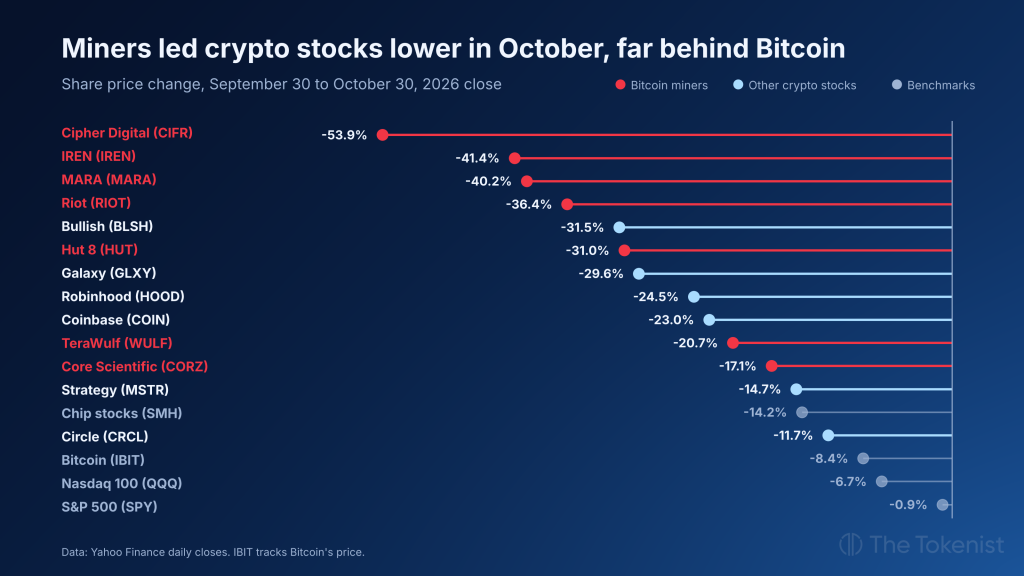
Miners: Cipher -53.9%, IREN -41.4%, MARA -40.2%, Riot -36.4%, Hut 8 -31.0%. TeraWulf (-20.7%) and Core Scientific (-17.1%) bounced off mid-month lows
Exchanges and brokers: Bullish -31.5%, Galaxy -29.6%, Robinhood -24.5%, Coinbase -23.0%
Closest to Bitcoin: Strategy -14.7% and Circle -11.7%
Strategy is the tell. A company that is mostly a pile of Bitcoin fell in line with chip stocks (-14.2%), not with miners, and Circle, which earns interest on stablecoin reserves, fell least of all.
The trading venues had their own problem. Most of Coinbase’s and Robinhood’s losses came after October 14, once the hedge fund streak was over, and Friday alone took 10.6% off Coinbase and 7.2% off Robinhood.
The timing points to AI money for the miners, though it is no proof: Bitcoin’s own 8% slide and a weaker hashprice cut into their mining revenue too.
IREN Stock Price Analysis: Can It Hold $23 Into Thursday’s Results?
IREN is the clearest test of the AI trade among crypto stocks, and it reports fiscal first-quarter results on Thursday, November 5. The stock closed Friday at $23.95, down 8.8% on the day, after touching $23.06, its lowest in a year.
The daily chart shows a stock that lost its floor. The July 29 low at $28.93 held through the summer, gave way on October 15, and turned into the ceiling: IREN’s bounce stalled at $28.88 on October 28 and fell the next two days.
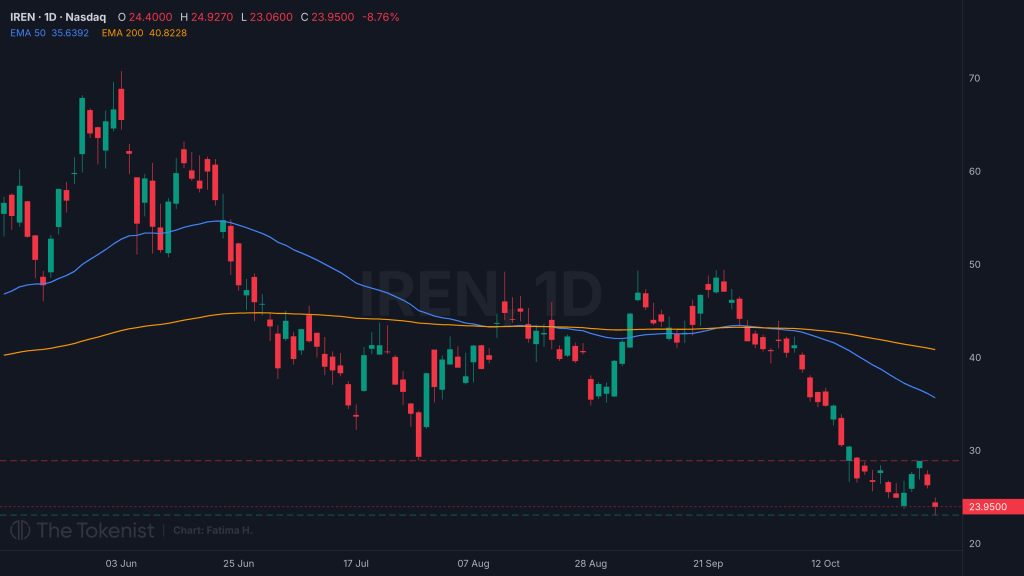
May 12 to October 30, 2026: IREN 1D chart. Source: Yahoo Finance (Nasdaq).
Both averages are far above. The 50-day EMA (exponential moving average) sits at $35.64 and the 200-day at $40.82, and the 50-day crossed below the 200-day on September 30, just before the selling began.
Resistance: $28.88, the October 28 high and the old July floor, then the 50-day EMA at $35.64
Support: $23.06, Friday’s 52-week low, then the $20 round number
Scenario | Condition | Where it could lead |
|---|---|---|
Advance | Results lift IREN to a daily close above $28.88 | The 50-day EMA at $35.64 |
Pause | IREN holds between $23.06 and $28.88 after the report | A base while hedge funds finish cutting AI |
Retreat | A daily close below $23.06 | $20, the next round number |
For crypto stocks, Thursday is the first chance to see whether AI customers are still paying the miners, or whether October’s selling was right about the capital running out.


Comments
Log in or sign up to join the conversation.