


S spot Bitcoin exchange-traded funds (ETFs) lost a net 4,658 BTC, about $296.7 million, in their latest daily update, on-chain tracker Lookonchain reported on Thursday, November 19. Over seven days, the funds shed 15,314 BTC, or $975.5 million. All five of the largest funds posted outflows on both the day and the week.
On the same day, Russia moved the other way. A Bank of Russia official said the central bank plans rule changes that would let investment funds for qualified investors buy Bitcoin directly, with the first products possible in 2027. Retail access to crypto futures is also being weighed, but later.
We compared the week’s ETF selling with the new coins miners produced over the same days. The selling was almost five times larger. So, can new buyers like Russia fill a gap this big?
Bitcoin ETFs: Every Major Fund Saw Outflows This Week
Lookonchain’s table shows the selling was broad, not limited to one issuer:
BlackRock (IBIT): -2,377 BTC on the day and -9,417 BTC over the week, about 61% of the weekly total. It still holds 778,966 BTC, the largest stash by far.
Fidelity (FBTC): -1,109 BTC on the day and -2,348 BTC over the week.
Grayscale (GBTC and BTC): -265 BTC on the day and -1,455 BTC over the week.
Bitwise (BITB) and ARK 21Shares (ARKB): -586 and -308 BTC on the day, -955 and -838 BTC over the week.
Together, the US funds now hold 1,231,539 BTC, worth about $78.45 billion. The week’s outflows equal about 1.2% of that.
Ethereum ETFs saw the same pattern on a smaller scale. They lost 9,904 ETH, about $17.9 million, on the day. Over the week, outflows reached 65,373 ETH, or $117.8 million. BlackRock’s ETHA accounted for most of it.
US BTC ETF Selling Was 4.8 Times the New Supply
Every day, miners create new BTC as a reward for adding blocks to the network. We counted the blocks added in the seven days to Thursday afternoon UTC on mempool.space, a public block explorer: 1,030 blocks at 3.125 BTC each, or about 3,219 new BTC.
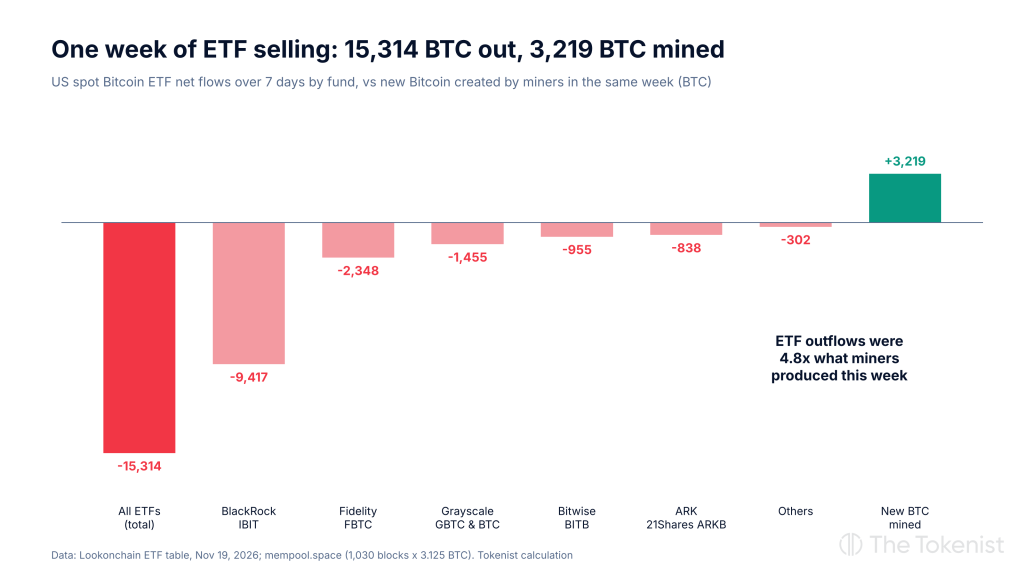
The gap: ETF outflows of 15,314 BTC were 4.8 times the BTC miners produced in the same week.
What it means: when investors pull money from an ETF, the fund gives up coins to pay them back, and most of it ends up sold in the market. Other buyers have to absorb that on top of what miners sell.
The price: BTC fell from about $74,000 on November 11 to a low near $62,000 on November 15. It trades near $64,000 now.
This is where Russia’s plan looks small for now. From November 17, ordinary Russian investors can buy BTC through licensed brokers and exchanges, but only up to 300,000 rubles a year per intermediary. That’s about $3,670, or roughly 0.057 BTC at today’s price. It would take about 267,000 Russians buying the full amount to match one week of US ETF selling.
Russia’s Bitcoin Plan: Funds First, Retail Futures Later
Russia legalized regulated crypto trading this year, and the rules are rolling out in steps:
Retail spot access: since November 17, retail investors can buy BTC, ETH and USDT after passing a knowledge test. The rules come from a Bank of Russia ordinance that sets the 300,000-ruble yearly cap. Qualified investors, who meet wealth or experience thresholds, have no cap.
Qualified funds: Olga Shishlyannikova, who heads the central bank’s department for investment intermediaries, spoke on November 18. She said the bank is considering rule changes next year to let funds for qualified investors buy crypto. Today, those funds can only use derivatives that pay out in cash. The first products could come in 2027, once the changes are registered with the Ministry of Justice.
Retail funds and futures: funds for ordinary investors are not part of the plan for now, and retail access to crypto futures is only being weighed, with no timeline.
Next steps: Moscow Exchange plans to start crypto trading on December 1, and direct peer-to-peer crypto trades are set to end in July 2027.
For Bitcoin, Russia is a long-term story. Regulated funds could add steady demand from 2027, but none of it arrives in time to offset this month’s ETF selling.
Bitcoin Price Analysis: $62,300 Has Held Twice
On the daily chart, Bitcoin trades at $64,037. That is below its 50-day exponential moving average (EMA), an average that gives recent prices more weight, at $75,258, and its 200-day EMA at $75,627.
Support: $62,300, where BTC bounced on November 15 and 18, after holding in February, June, July and August. Below that, $57,800, the July low.
Resistance: $65,500, a level that turned BTC back in June, July and August. Above that, $74,300.
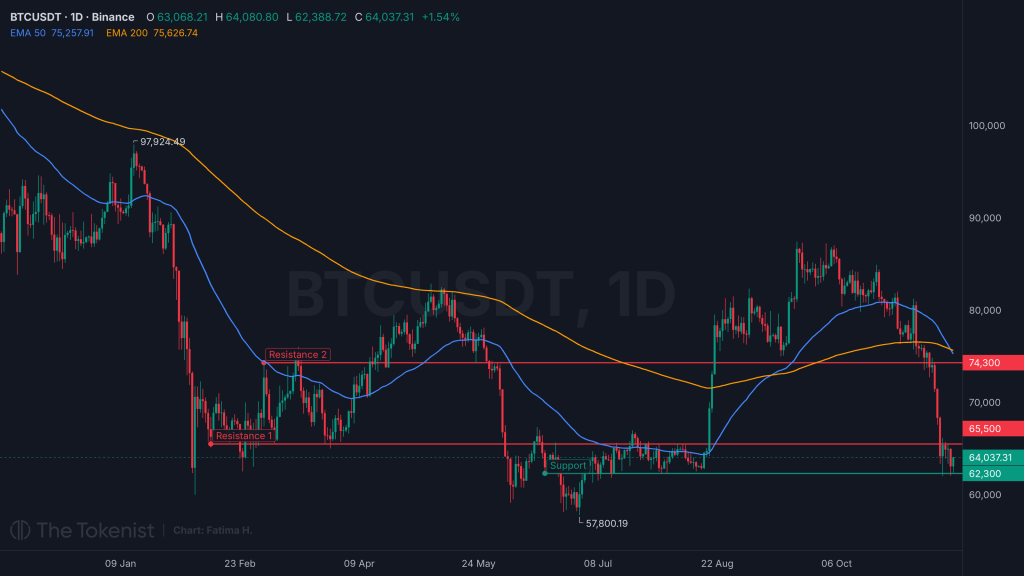
BTCUSDT 1D chart. Source: TradingView
Scenario | Condition | Where it could lead |
|---|---|---|
Advance | A daily close above $65,500, with ETF flows turning positive | $74,300, the March-September level |
Pause | Price stays between $62,300 and $65,500 | A range near current levels |
Retreat | A daily close below $62,300 | $57,800, the July low |
For Bitcoin, the number to watch is the daily ETF flow. A few days of inflows would ease the pressure on $62,300. Another week like this one, with outflows near five times new supply, would make that support much harder to defend.



Comments
Log in or sign up to join the conversation.