

It is time for a market observation post on crude oil. I simplified my analysis approach to quickly understand current market structures for potential trades.
The thing is, there is a professional way to analyze the market with volume profiles, acceptance/rejection areas, high/low volume areas, TPO (time) profiles and VWAPs including the comprehension of various profile shapes and the concept of value and distribution areas etc. As you can see it is pretty complex but after a while you will get into it step by step like with any other new skill or tool. In the end you will be able to see all these things in a plain chart.
The other way would be to analyze the market with plain charts and determine whether the market is balanced or imbalanced on various time frames, starting from the weekly chart in my case. On the way to the lower time frames we can then identify support/resistance levels and potential liquidity areas.The next important aspect would the timing of the trade execution after we identified a potential trade area. Actually, that’s it, roughly.
Before we dig into the charts, let us take a look at some fundamentals. Firstly, looking at the Crude oil inventories report we can see that the U.S. commercial crude oil inventories (excluding those in the Strategic Petroleum Reserve) increased by 2.5 million barrels from the previous week with a forecast of a decrease by 0.5 million barrels. The market reacted on that day with a sell off. Last but not least, at 523.6 million barrels, U.S. crude oil inventories are still at historically high levels for this time of year which you can see on this chart:

The next thing is to take look at the Commitments of Traders (COT) report in order to get a grasp what the managed money sector is doing. Looking at this Options and Futures Combined Positions (NYMEX + ICE) report, we can see that money managers were net buying 88.924 contracts of WTI crude oil in the week ended August 23. The number includes a huge short covering with 68.867 contracts. Interesting, as we had some huge short covering in the previous week as well.

The CME Group has a nice tool to visualize all this. We can see the decrease in short positions, increase in long positions and the current increase in the net positions:

Also, we can see a little increase in the Open Interest after a drop which would conclude a potential more bullish scenario.

With all that in mind, let’s take a look at our charts. As mentioned I want to show my simple analysis approach on a plain chart today. Looking at the weekly time frame, we can observe a one time framing higher behavior inside of a “larger” balance area. Seems like the market is heading towards the balance area high. However, the previous week closed inside of the previous week’s upper range without taking out the previous week’s high or low. In short, it’s an inside week. I will be interested in which direction the market will break.

Moving forward to the daily perspective, we can again observe a balance area. I would assume we want to test the balance area high. Anyway, the expectation is a rotational behavior and we should lean on the balance extremes until the context of the market would change.

Now then, let us move lower to the 240 minutes chart (4h). We can identify the liquidity area as well as the balance extremes. These marked extremes are the areas of interest for me in the coming week.
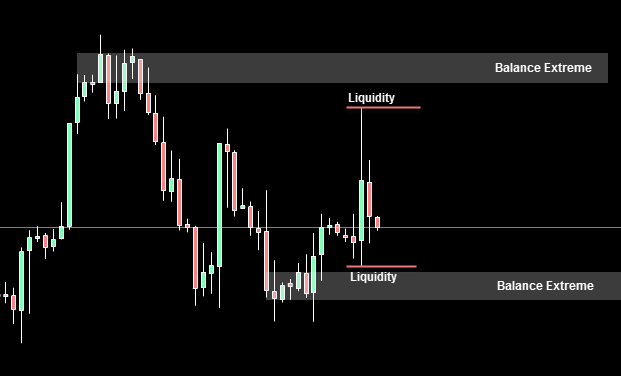
The next period would be the hourly chart and to use tools like the Price Retracement or the VWAP to find some levels of confluence. This is something I share only with our members in our real time market observation area. In the coming week I will try to comment about my observations in real time there.



Comments
Log in or sign up to join the conversation.