

Some seasonal trends are counter-intuitive.
For example, the price of crude oil drops despite the start of the heating season in the fall. Would you have known?
That is why it is important for you to check seasonal trends closely. With the help of our seasonal charts, you can do this in a matter of seconds.
But back to crude oil: what is the current seasonal situation?
Crude oil is seasonally strong!
Using a seasonal chart, take a look at the actual seasonal development of the spot price of the important oil type: West Texas Intermediate (WTI).
The following chart shows you the average performance of chained crude oil futures depending on the time of year. On the horizontal axis you can see the time of year, on the vertical axis the average trend over the past 25 years as a percentage. This allows you to recognize the seasonal trend of crude oil at a glance.
Crude oil, seasonal trend, calculated over 25 years
(Click on image to enlarge)
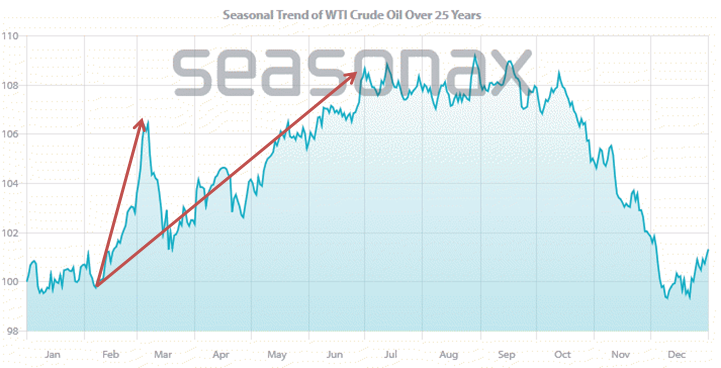
Crude oil is seasonally firm until July. Source: Seasonax
Two strong phases are coming up!
As you can see on the right of the chart, contrary to the expectations of most market observers, the price of crude oil typically falls in October/November at the start of the heating season.
However, you can also see that there are currently two positive seasonal phases, which even start simultaneously. One is short-term and the other medium-term – so there is a good seasonal opportunity for every type of investor. I have marked the two rises with arrows in the chart. The two phases are as follows:
● February 11 – March 5 with a duration of 22 calendar days
● February 11 – July 1 with a duration of 140 calendar days
More By This Author:
Is Copper Calling?A Vision For Visa
Time To Buy Tesla Shares?



Comments
Log in or sign up to join the conversation.