

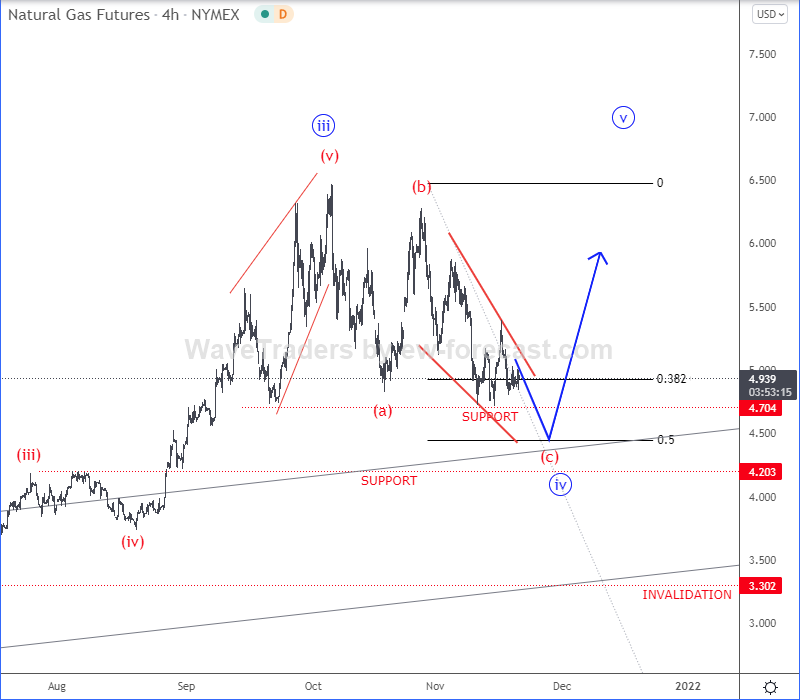
Natural gas is still trading at the potential first 4.7 support level for wave »iv«, but be aware of a potential intraday wedge pattern within wave c) of »iv« that can drop even down to the second 4.2 support level before a bullish continuation for wave »v«.

Photo by American Public Power Association on Unsplash
Natural Gas 4h Elliott Wave Analysis
(Click on image to enlarge)
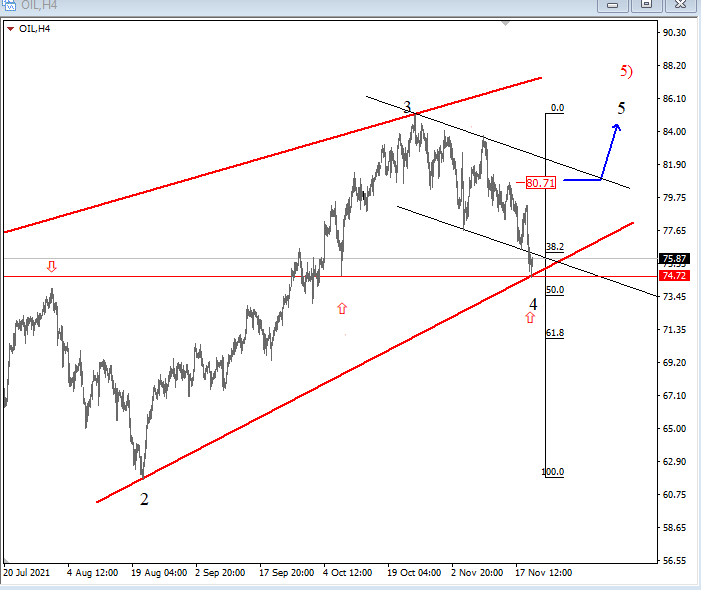
Crude oil is making a deeper reversal in the 4-hour chart but still looks corrective, ideally as part of wave 4 a bigger ending diagonal pattern within a higher degree wave 5) on a daily chart. So, in case if Crude oil bounces and starts recovering back above 80.71 region, we can easily expect it back to highs for the final wave 5 of 5).
Crude OIL 4h Elliott Wave Analysis



Comments
Log in or sign up to join the conversation.