


A$1,551 Bitcoin drop from $85,341 to $83,790 over 25 minutes on October 7 coincided with $412.62M in crypto liquidations in a single hour, with more than 97% on the long side, according to CoinGlass data.
The episode showed how crowded leverage can turn a relatively limited BTC price decline into a broader forced-selling cascade, but the available reporting did not establish a confirmed fundamental catalyst for the initial move.
Bitcoin briefly traded as low as $83,577, extending the decline below the closely watched $84,000 level. The central question is therefore not whether leveraged positions amplified the move, which the liquidation imbalance strongly indicates, but what triggered the first leg lower; the cited data do not answer that question.
Bitcoin’s One-sided Liquidation Flush Exposed Crowded Leverage: What Caused the Crash?
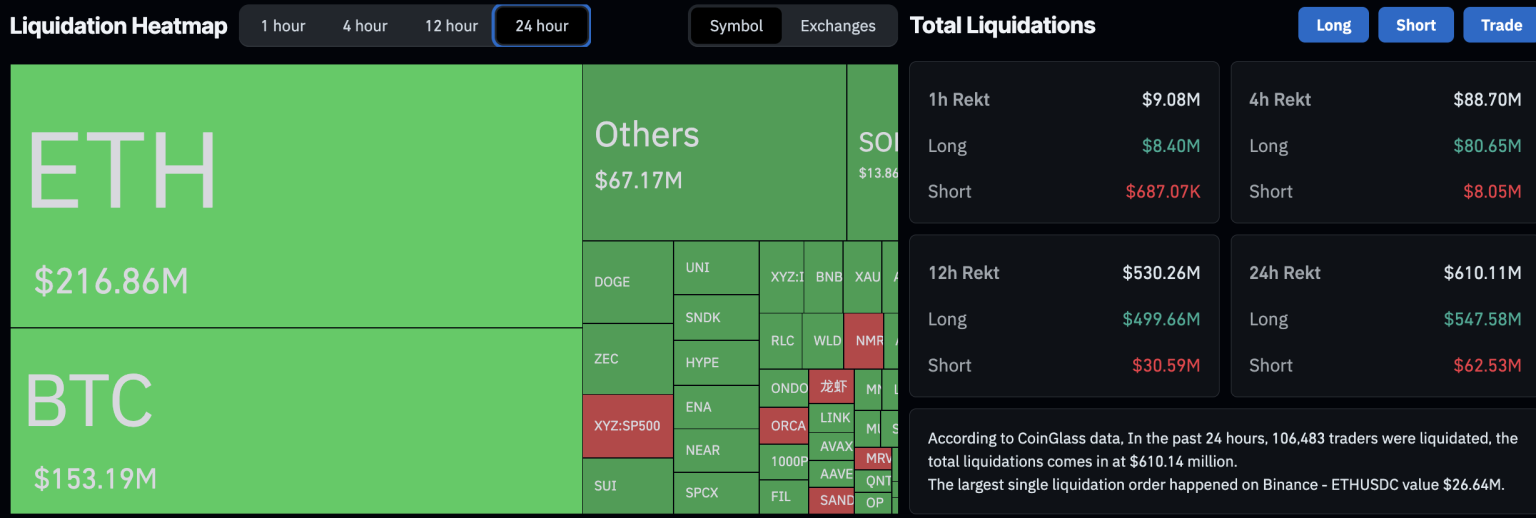
The decline began at 01:45 UTC, and over 15 minutes Bitcoin fell to $83,577, down roughly 2.1%, with little intervening recovery. The market suffered $412.62M in liquidations across crypto markets over one hour, including $11.79M in short liquidations.
That leaves more than $400M on the long side, consistent with the report’s estimate that longs represented over 97% of the hourly total. The time window matters: the one-hour total is distinct from the $479M in long liquidations reported across 24 hours.
CoinGlass also shows that 104,836 traders liquidated over that 24-hour period. Those figures describe forced closures, not the amount of selling that initiated the decline, so the data support an amplification mechanism rather than proof that liquidations caused the first price drop.
Other large-cap tokens weakened alongside Bitcoin. Ethereum fell from about $2,688 to $2,591, while XRP moved from $1.49 to $1.43 before both recovered some ground.
The October 10 Comparison Puts This Current Selloff in Perspective
On October 7, 2026, a flush occurred just days before the anniversary of the October 10, 2025 liquidation event, which saw over $19Bn in leveraged-position liquidations impacting more than 1.6 million traders.
The October 7 report noted $479M in long liquidations (about 2.5% of the 2025 total) affecting approximately 104,836 traders (6.5% of the earlier figure). This event was smaller than the previous week’s shakeout, where Bitcoin dipped below $83,000, resulting in 129,197 liquidations.
While anniversary risk might influence trader exposure, there’s no evidence suggesting that memories of the 2025 event affected positioning ahead of the recent decline. Additionally, large derivatives expiries can impact market volatility, separate from the current liquidation event.
Bitcoin Liquidation Maps Show Risk Zones, Not a Confirmed Catalyst
SOURCE: bitcoincounterflow.com
On-chain analytics across social media reported that four newly created wallets deposited $1M in USDC to Hyperliquid and opened 40x shorts on 148.49 BTC, worth about $12.5M, shortly before the decline.
The timing drew attention, but whether the trades reflected luck, skill or advance knowledge remains unproven. The observation does not establish wrongdoing, manipulation or a causal role in the selloff.
The same report noted scrutiny of two linked Hyperliquid accounts holding $1.58Bn in shorts, but that position data alone does not establish a connection to the October 7 move.
Separately, reports of weakness in Asian markets, higher oil prices, rising yields and a stronger dollar were contemporaneous conditions; the primary reporting did not confirm any of them as the trigger for Bitcoin’s drop.
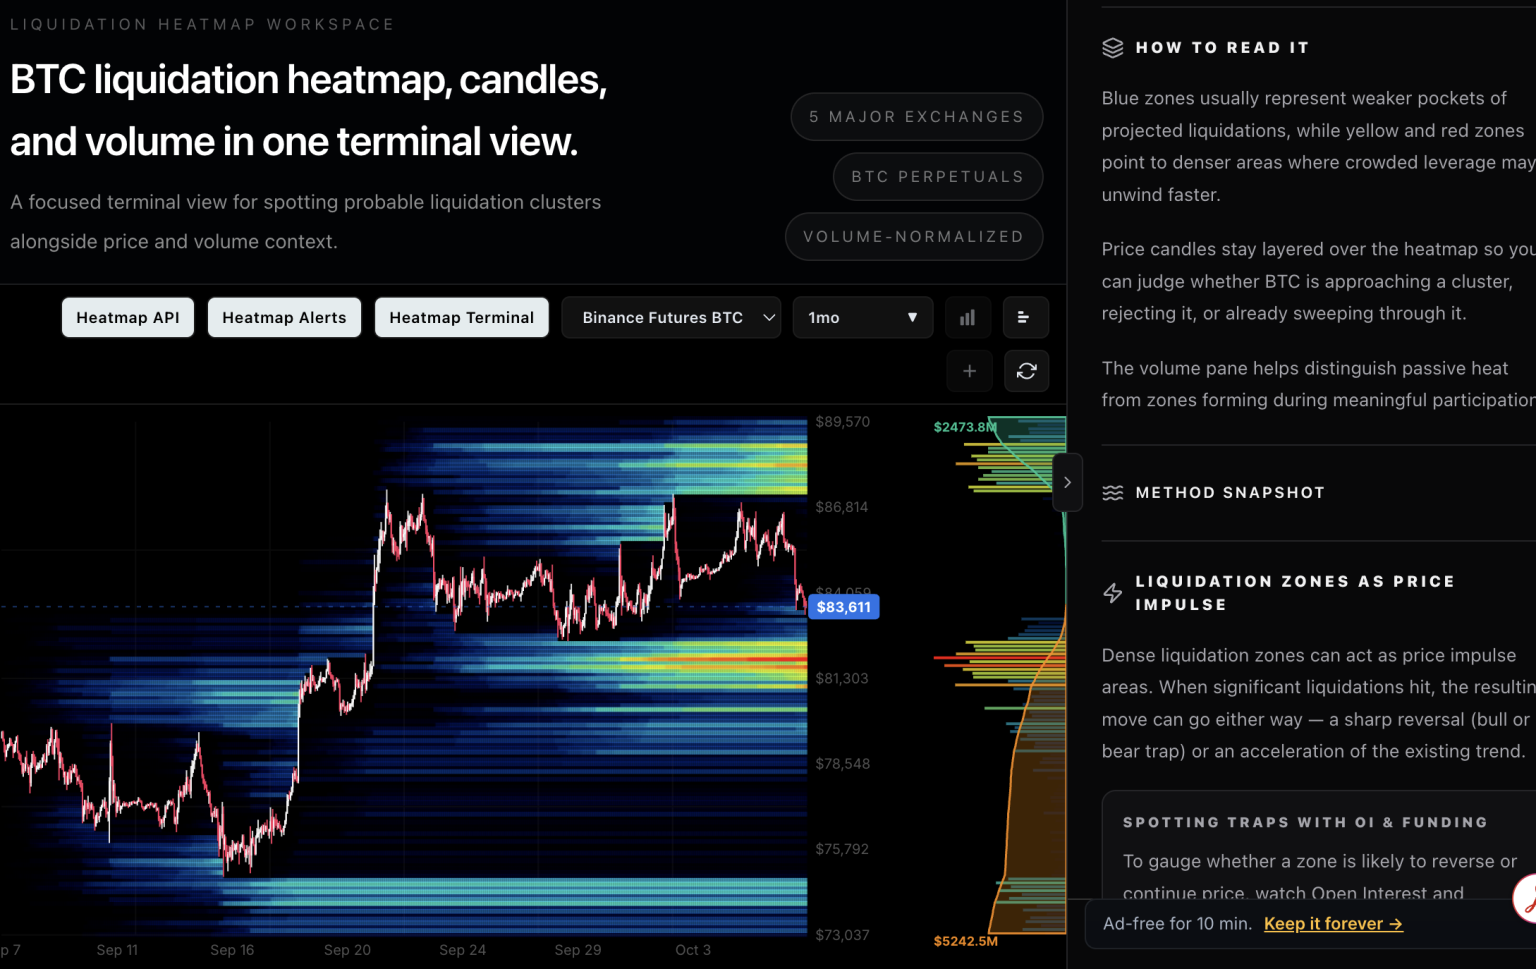
CoinGlass mapped a dense liquidity pool around $82,600 below the market and another around $87,400 overhead. Bitcoin’s $83,577 low stopped about $1,000 short of the lower cluster.
This leaves a potential concentration of long liquidations beneath the intraday low. These maps identify areas where leveraged positioning may be vulnerable, not guaranteed price destinations.


Comments
Log in or sign up to join the conversation.