

The following two charts show the Treasury net of outlays - receipts, the Treasury account balance (TCB), and the SPX. The first chart is from 2014 when Russia annexed Crimea. The SPX went sideways for a couple of months, but did not collapse. In fact, the SPX went on to rally.
2014
(Click on image to enlarge)
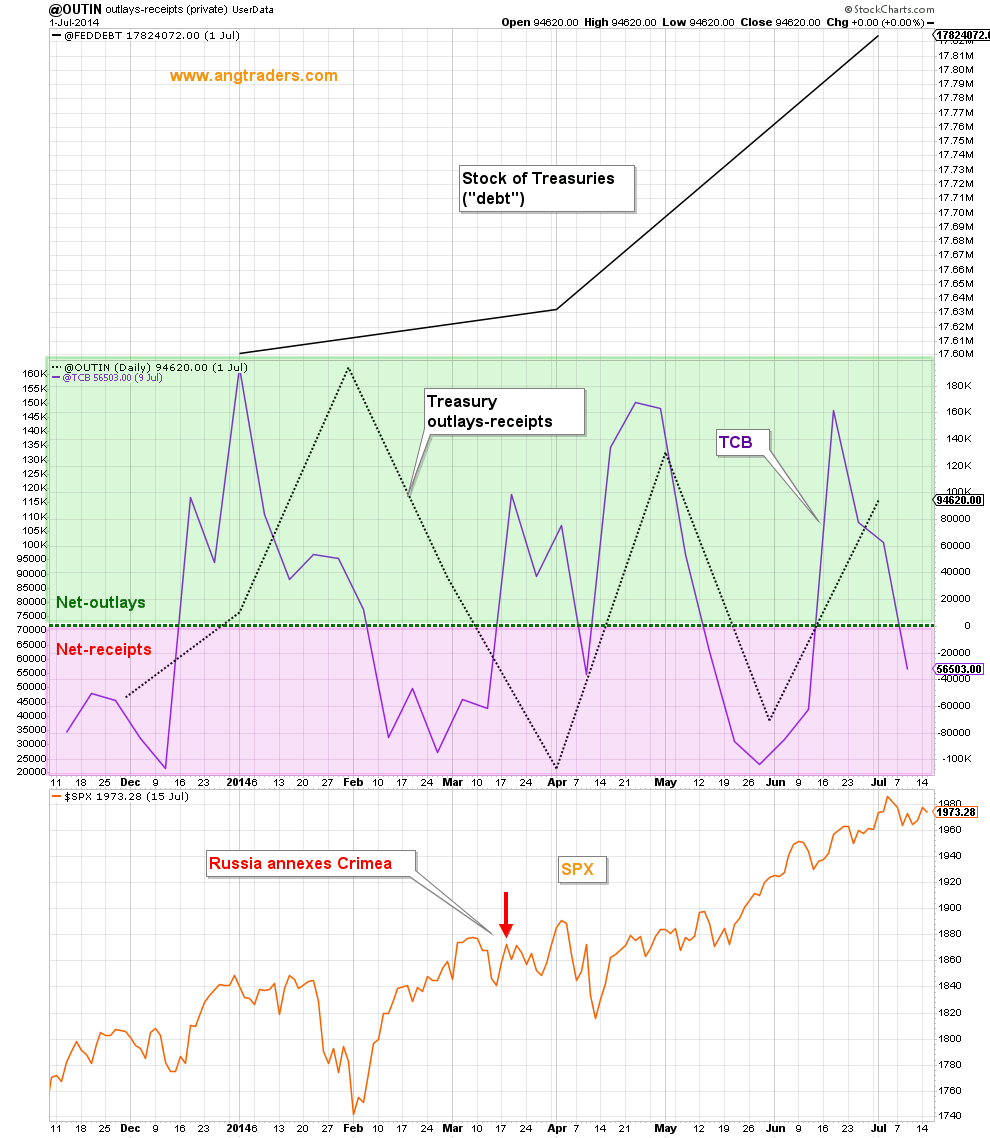
Like in 2014, the current picture shows the net-flows have been negative (net-receipts into the Treasury) and the "debt" is growing as Russia invades. The fact that net-transfers have been positive since the start of February (chart below only shows quarterly net-transfers, but we track the daily numbers), makes us confident that the market won't collapse and instead rally after a period of sideways pricing...like in 2014.
2022
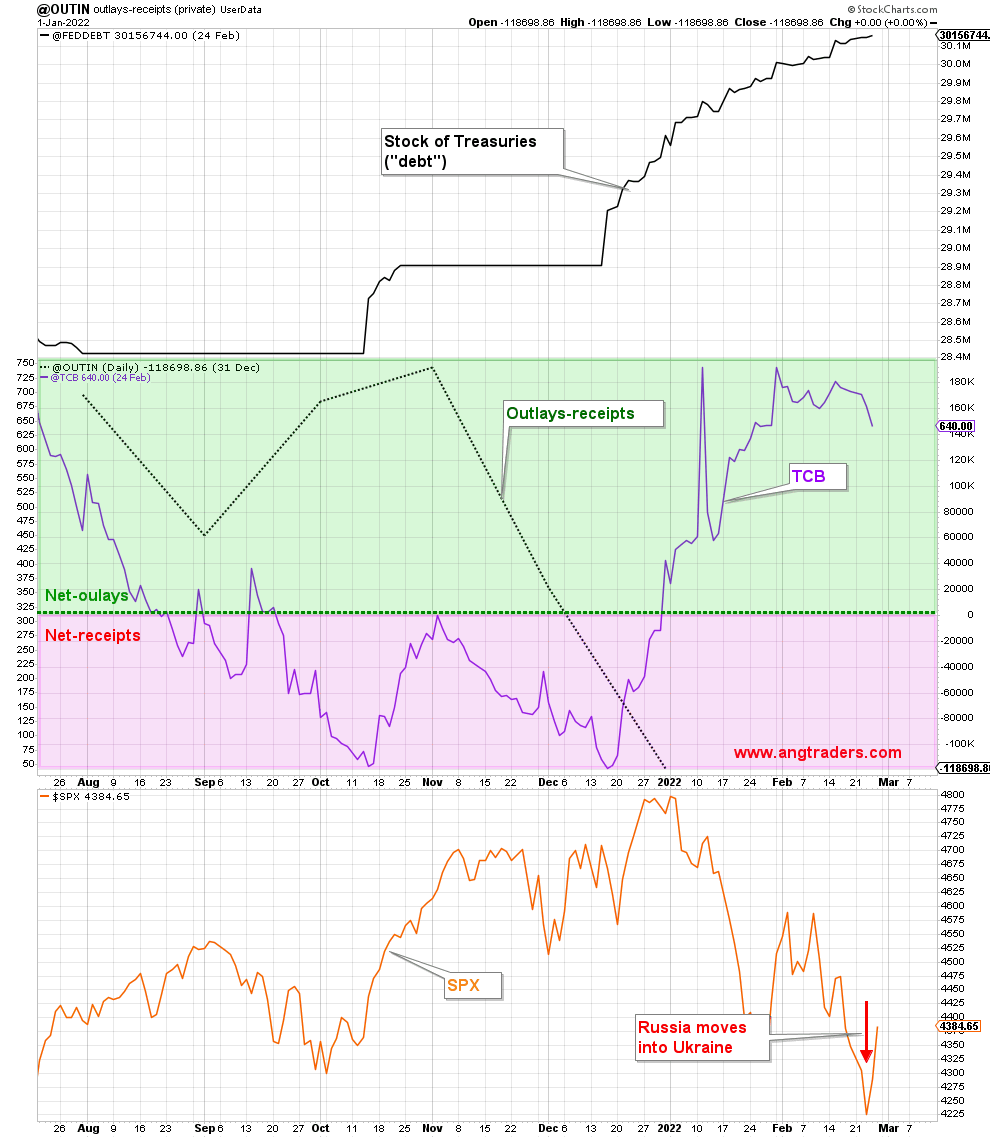
Perversely, war is good for stocks. Especially when it is someone else's war and it is someone else's destruction.



Comments
Log in or sign up to join the conversation.