

“The Coalition for a Prosperous America” releases what it burbles as a “Groundbreaking CPA Study…” entitled “Quantifying Economic Growth and Job Creation from a Competitive Dollar”. Don’t be fooled by all the footnotes and the numbers. At the basis of the analysis is the aphorism: “Neither a borrower nor a lender be”.
Here’s how the email from CPA described the study:
A new study of the US economy fromthe Coalition for a Prosperous America (CPA) economics team shows that the US dollar is overvalued by 27 percent. Adjusting the dollar to a competitive level would yield large benefits to the economy, including an estimated $1 trillion in additional GDP and up to an additional 6.7 million new jobs over six years.
Here’s the basic picture we’re working with:
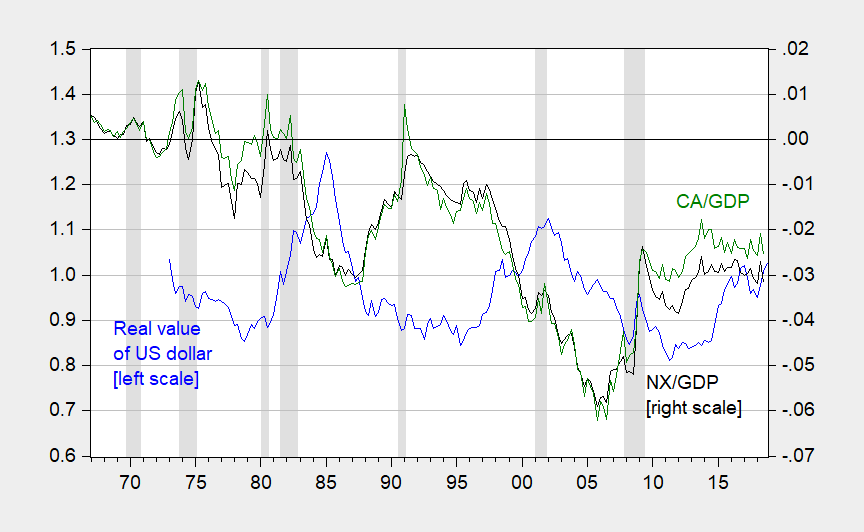
Figure 1: Real value of US dollar (broad, 1973M01=1) (blue, left scale), and net exports to GDP (black, right scale), current account to GDP (green, right scale). NBER defined recession dates shaded gray. Source: Federal Reserve Board, BEA, NBER, and author’s calculations.
The current account surplus equals the amount a country lends to the rest-of-the-world. So, setting the “right” CA balance at zero means one believes countries at equilibrium should neither borrow nor lend.
At some point, the authors switch from discussion of the current account balance to trade balance, but since the two differ by only about 0.2% of GDP, the change is not consequential.
The authors reverse engineer the amount of exchange rate change (hence import price change) necessary to balance trade. This number turns out to be 27%.
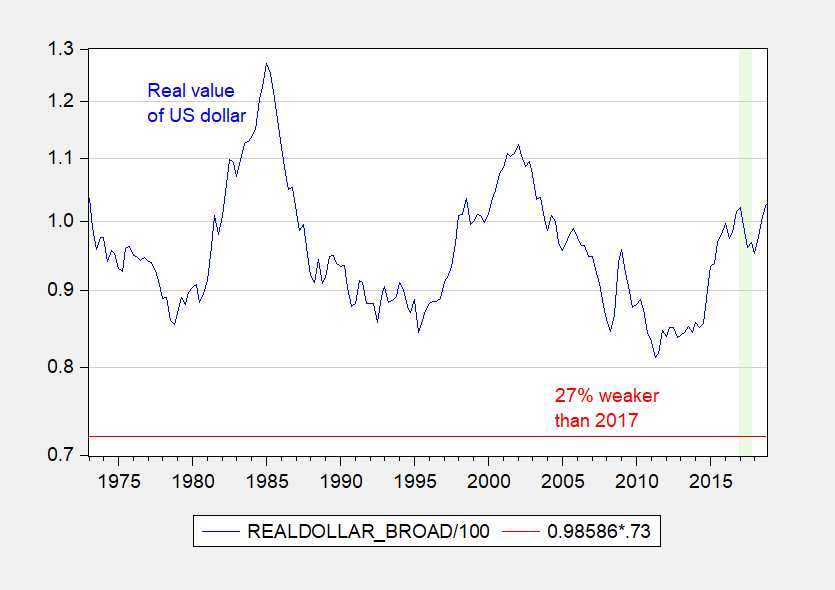
Figure 2: Real value of US dollar (broad, 1973M01=1) (blue), and 27% weaker dollar relative to 2017. Source: Federal Reserve Board and author’s calculations.
The sheer implausibility of this estimate is that a 27% reduction of the value of the broad trade weighted value of the US dollar from 2018Q4 levels would take us to levels never recorded…
I could spend a lot of time wondering about the econometric methodology (and how one can have the dollar drop 27% and have no other financial macro variables change — think about the question of where the 27%). But really, the fundamental question is … why is balanced trade the right metric for equilibrium?
A more nuanced approach is in the IMF’s EBA, extended and described in the IMF External Sector Report. In essence, estimate what the current account should be given demographics, fiscal policy, and then work backwards to implied exchange rate levels.
Addendum, 2/17 12:45PM Pacific: The CPA report works off of exchange rate pass through from nominal exchange rates to import and export prices. However, foreign inflation has trended downward since the last time the nominal value of the dollar was 27% weaker than in 2017. Nonetheless, I report below what 27% percent weaker in nominal terms looks like.
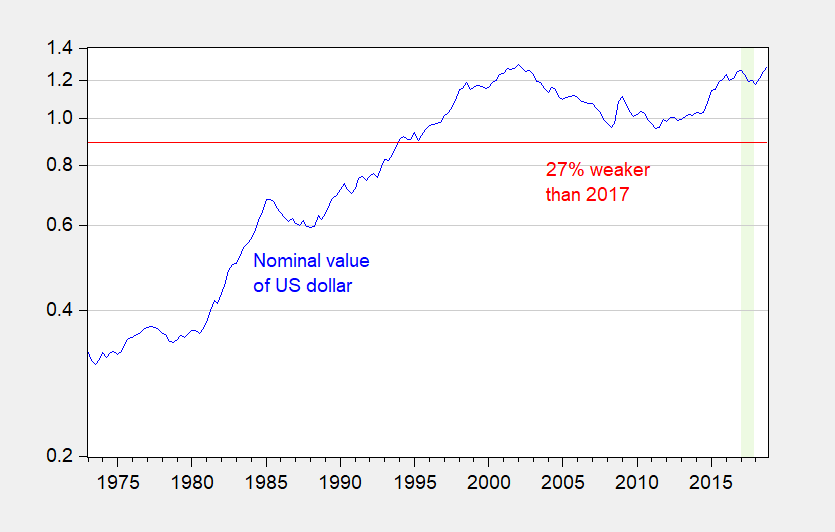
Figure 3: Nominal value of US dollar (broad, 1973M01=1) (blue), and 27% weaker dollar relative to 2017. Source: Federal Reserve Board and author’s calculations.
Achieving 27% depreciation in nominal terms given inflation and exchange rate change trends are no longer like those in 1994…


Comments
Log in or sign up to join the conversation.