
Typical headline – “U.S. Consumer Price Growth Cools, Smallest Gain in Seven Months“, and “Treasuries Rally After CPI Seen Pushing Off Taper: Markets Wrap” or “Consumer prices climbed more slowly in August, welcome news for the Fed“. Here’re the graphical depictions of the undershoot, first in levels (updating graph from yesterday’s post).
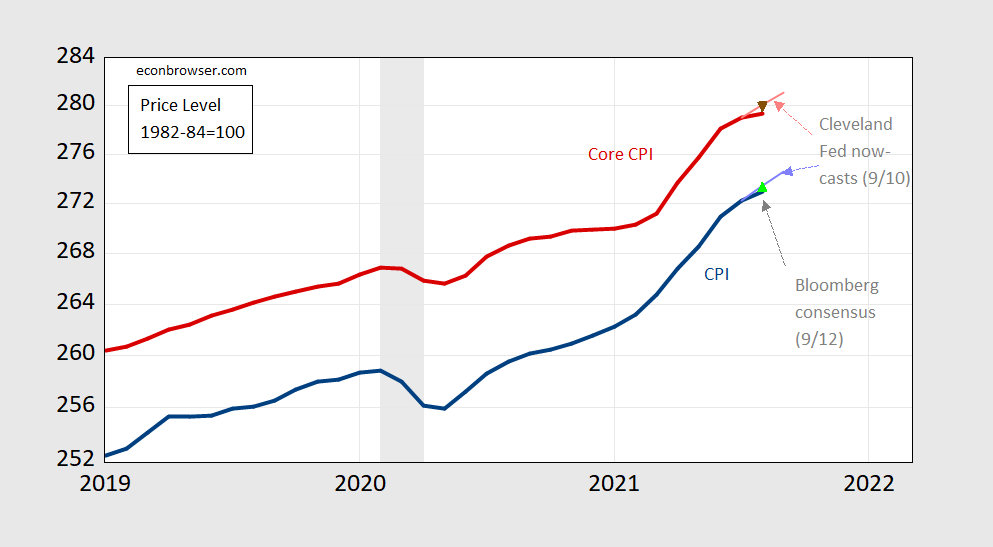
Figure 1: CPI (blue), CPI nowcasts (light blue), Bloomberg consensus CPI (light green triangle), Core CPI (red), Core CPI nowcasts (pink), Bloomberg consensus core CPI (inverted brown triangle), all 1982-84=100, on log scale. NBER defined recession dates shaded gray. Source: BLS, Cleveland Fed (as of 9/10), Bloomberg (accessed 9/12), NBER, and author’s calculations.
Next, month-on-month annualized inflation (0.10 reads as 10%).
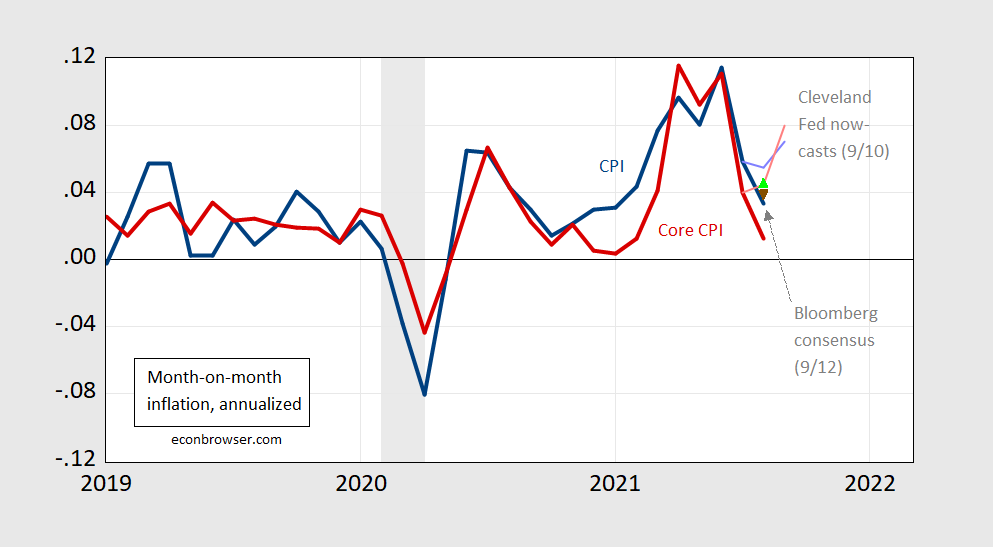
Figure 2: Month-on-month annualized CPI inflation (blue), CPI nowcasts (light blue), Bloomberg consensus CPI (light green triangle), Core CPI (red), Core CPI nowcasts (pink), Bloomberg consensus core CPI (inverted brown triangle), all 1982-84=100, on log scale. NBER defined recession dates shaded gray. Source: BLS, Cleveland Fed (as of 9/10), Bloomberg (accessed 9/12), NBER, and author’s calculations.
CEA decomposes the contributions to August inflation.
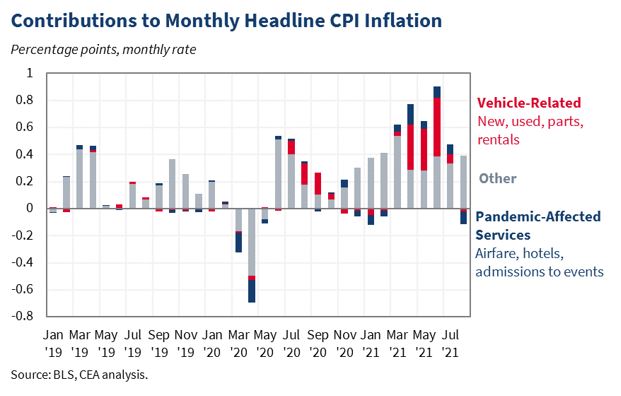
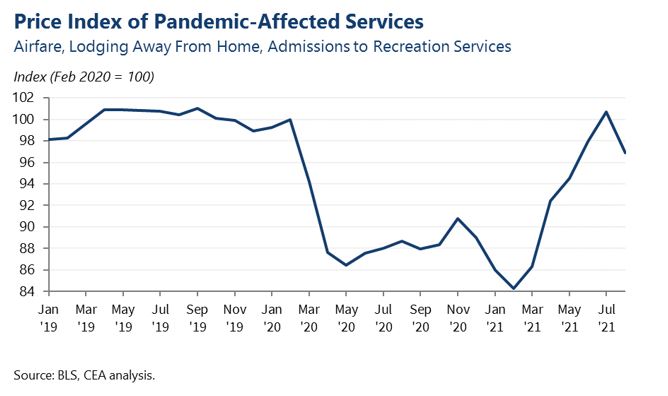
Vehicle-related inflation made essentially no contribution, while pandemic-related services deducted (in a mechanical, accounting sense). CEA also provides a time series on pandemic-affected services prices.
The undershoot has implications for nowcasts of August Personal Consumption Expenditure (PCE) deflator inflation. Below is the Cleveland Fed’s as of today:
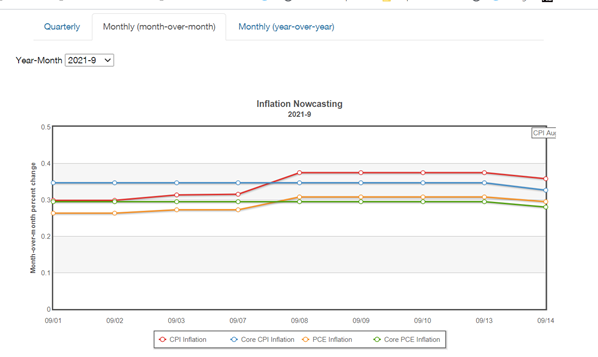
Source: Cleveland Fed, accessed 9/14/2021.
On an annualized basis, nowcasted PCE m/m inflation dropped from 3.75% to 3.59%, while nowcasted core PCE has dropped from 3.60% to 3.41%.


Comments
Log in or sign up to join the conversation.