
Month-on-month down, even if up year-on-year. Trimmed and sticky price inflation (m/m) are also down.

First, recall 12 month inflation rates (aka y/y rates) are largely backward looking. Month-on-month measures are more reflective of current conditions, albeit more noisy.
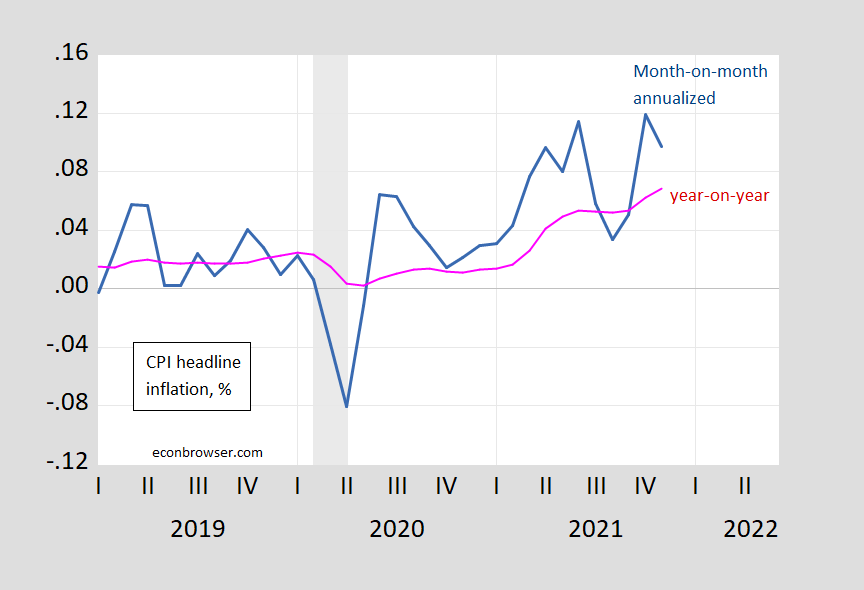
Figure 1: CPI month-on-month inflation rate, annualized (blue), 12 month or year-on-year inflation rate (pink), in decimal form (i.e., 0.05 means 5%). NBER defined peak-to-trough recession dates shaded gray. Source: BLS, NBER, and author’s calculations.
What do other measures of overall CPI inflation look like on a m/m basis?
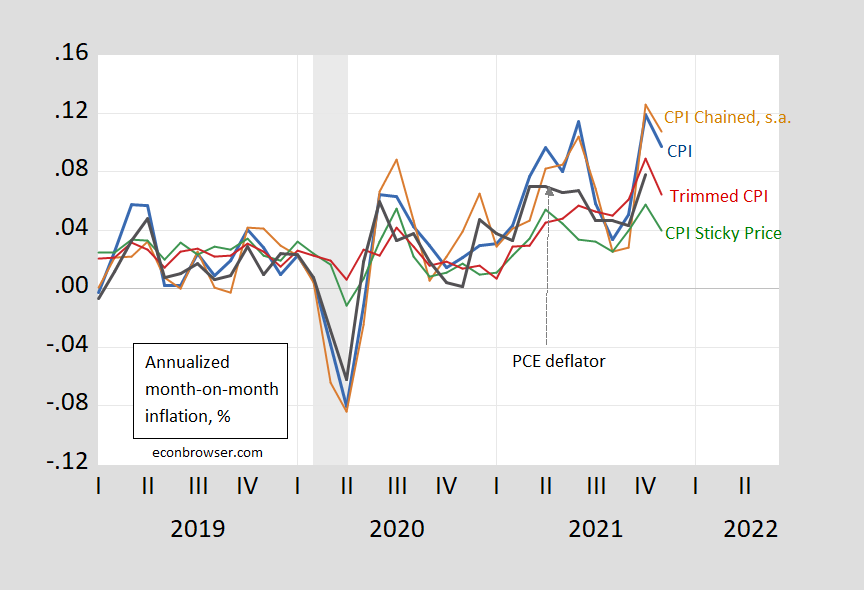
Figure 2: Month-on-month inflation of CPI (blue), chained CPI (brown), 16% trimmed CPI inflation (red), sticky price CPI inflation (green), personal consumption expenditure deflator inflation (black), all in decimal form (i.e., 0.05 means 5%). Chained CPI seasonally adjusted using arithmetic deviations (brown). NBER defined recession dates (peak-to-trough) shaded gray. Source: BLS, BEA, Atlanta Fed, NBER, and author’s calculations.
Figure 2: CPI – all urban (blue), , in decimal form (i.e., 0.05 means 5%). NBER defined peak-to-trough recession dates shaded gray. Source: BLS, NBER, and author’s calculations.
Chained CPI m/m inflation is down, as are trimmed mean and sticky price. A lower trimmed mean inflation means that the decline in broad-based, and not being driven by outliers. Declining sticky price inflation means that infrequently changed prices are rising, but at a slower pace than before.
Moving to core measures (i.e., excluding food and energy prices), we see the following picture (note the vertical scale is made to have the same range as in Figure 2 to better illustrate how core measures have exhibited less variability).
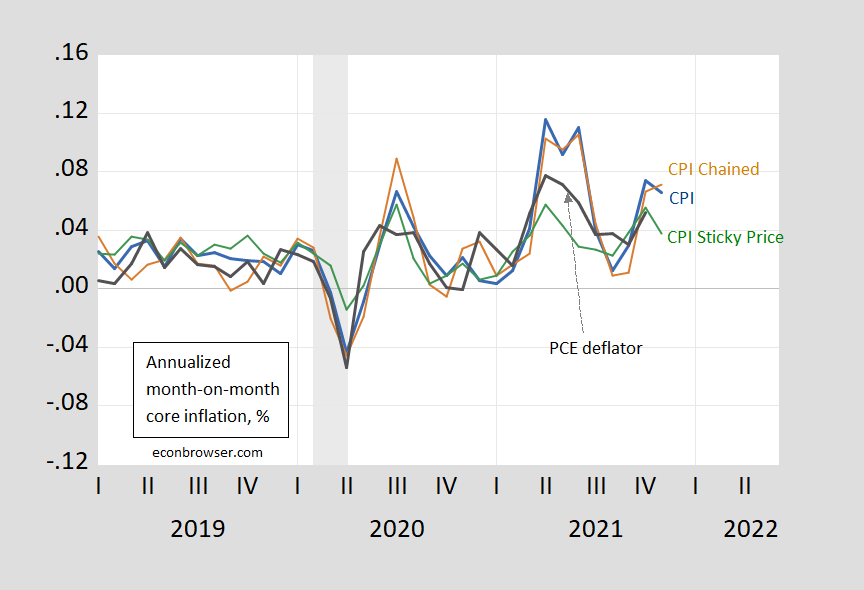
Figure 3: Month-on-month CPI core inflation (blue), chained CPI core (brown), sticky price CPI core inflation (green), personal consumption expenditure core deflator inflation (black), all in decimal form (i.e., 0.05 means 5%). Chained CPI seasonally adjusted using arithmetic deviations (brown). NBER defined recession dates (peak-to-trough) shaded gray. Source: BLS, BEA, Atlanta Fed, NBER, and author’s calculations.
Beware of “records”. On a month-on-month basis, inflation has been higher over the past 20 years.
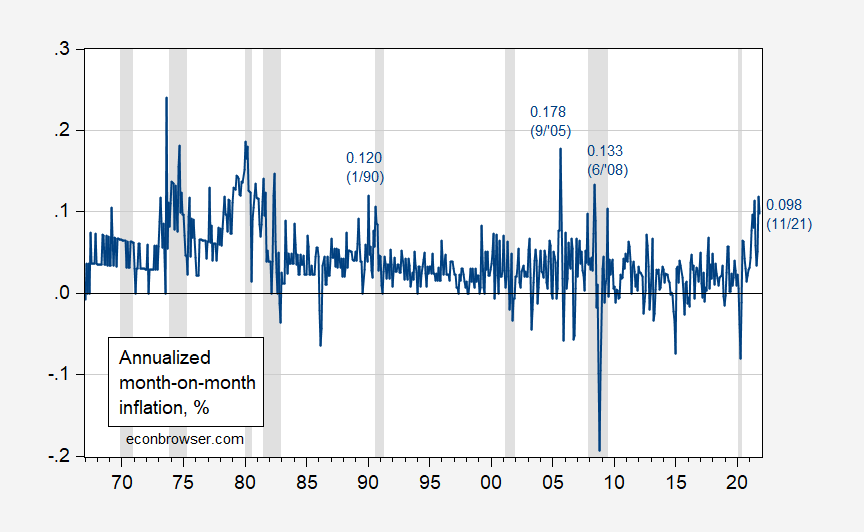
Figure 4: CPI month-on-month inflation rate, annualized (blue), in decimal form (i.e., 0.05 means 5%). NBER defined peak-to-trough recession dates shaded gray. Source: BLS, NBER, and author’s calculations.
A final observation: whether high inflation m/m persists depends in part on what happens to gasoline prices, as illustrated in Figure 5.
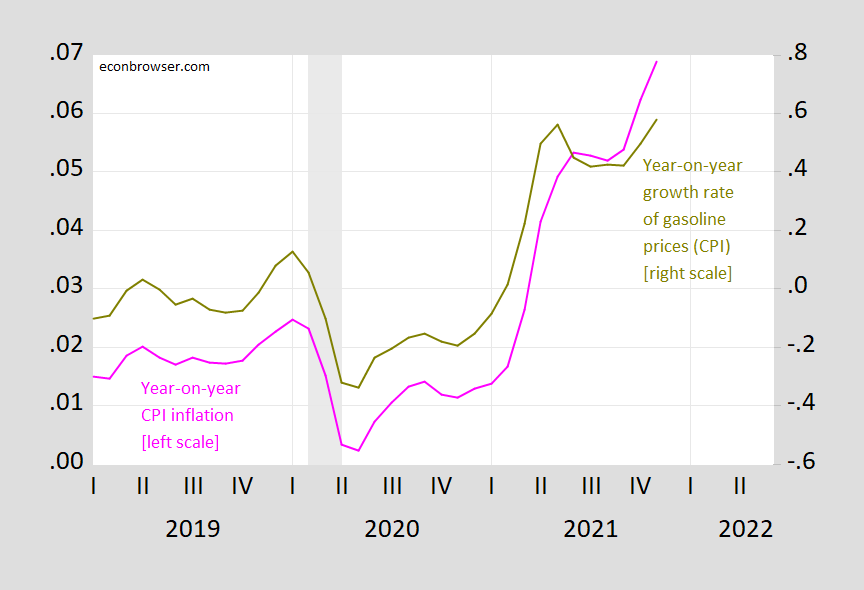
Figure 5: CPI year-on-year inflation rate (pink, left scale), CPI-gasoline component year-on-year inflation rate (chartreuse, right scale), in decimal form (i.e., 0.05 means 5%). NBER defined peak-to-trough recession dates shaded gray. Source: BLS, NBER, and author’s calculations.
Fortunately, oil futures are pointing downward, so indications are for relief on that end (OIL).


Comments
Log in or sign up to join the conversation.