

One year ago (7/29):
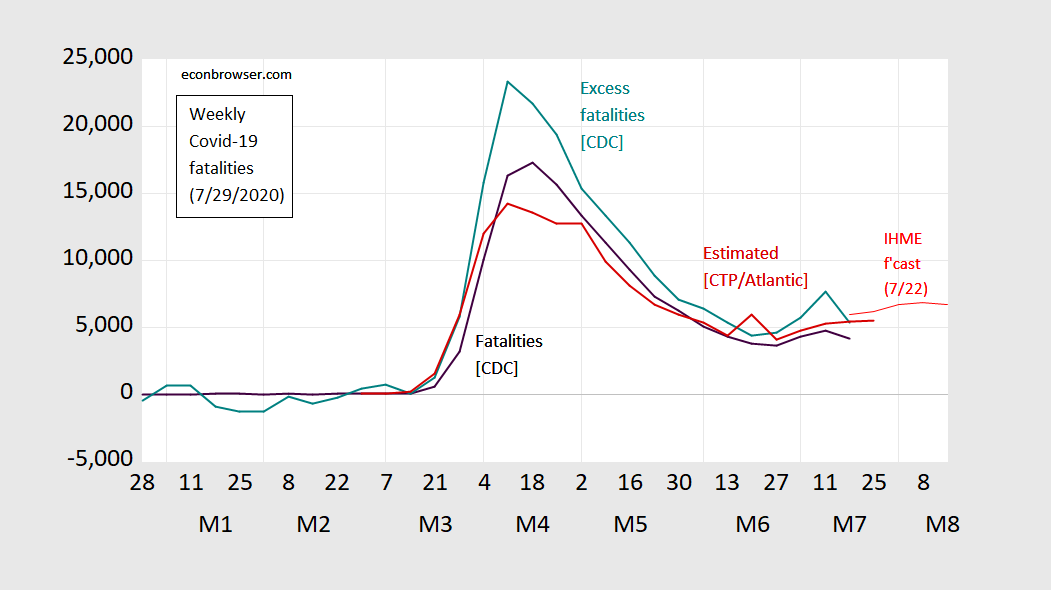
Figure 1: Weekly fatalities due to COVID-19 as reported to CDC for weeks ending on indicated dates (black), excess fatalities calculated as actual minus expected (teal), fatalities as tabulated by The COVID Tracking Project/Atlantic (dark red), IHME forecast (light red). Source: CDC 7/29/2020 vintage, COVID Tracking Project/Atlantic accessed 7/29/2020, IHME forecast of 7/22/2020, and author’s calculations.
And today (7/24):
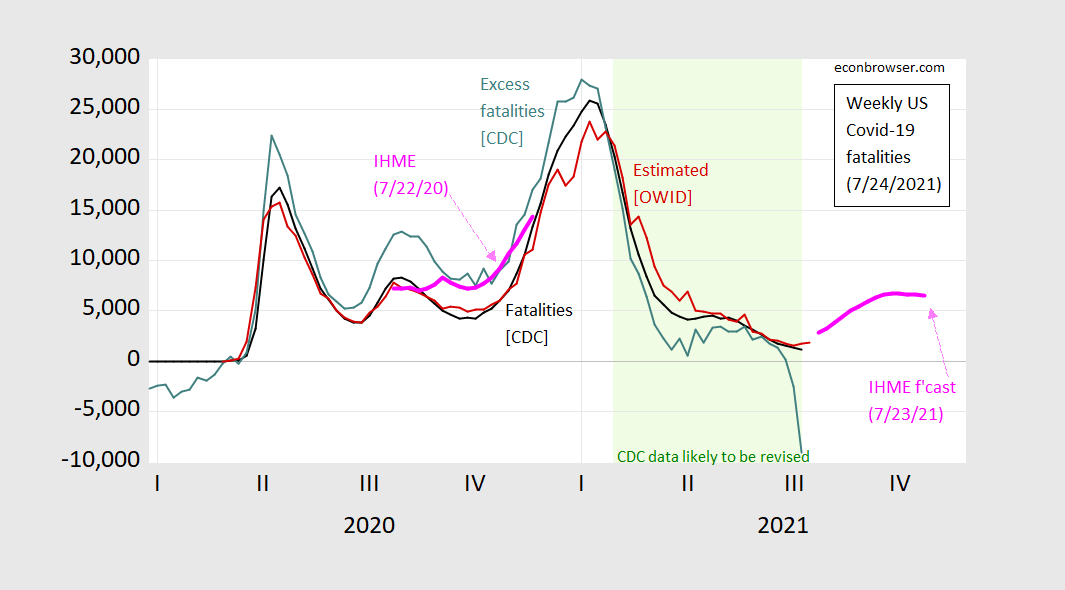
Figure 2: Weekly fatalities due to COVID-19 as reported to CDC for weeks ending on indicated dates (black), excess fatalities calculated as actual minus expected (teal), fatalities as tabulated by Our World in Data (dark red), IHME forecast (bold pink). Light green shading denotes CDC data likely to be revised, as noted by CDC. Source: CDC accessed 7/24/2021, Our World in Data, accessed 7/24/2021, IHME forecasts of 7/22/2020, 7/23/2021, and author’s calculations.
IHME predicted excess fatalities pretty well (as opposed to CDC officially designated COVID-19 deaths, or those reported to Our World In Data). The current IHME reference scenario forecast implies about 60,000 additional fatalities by November 1st. This wave doesn’t seem so bad — until you think about the fact that this is occurring in the summer months, when people are less likely to be inside and in close contact.
For confidence bands for reference scenario, and “worse” scenario, as well as geographic distribution of fatalities, see this post from earlier today.



Comments
Log in or sign up to join the conversation.