

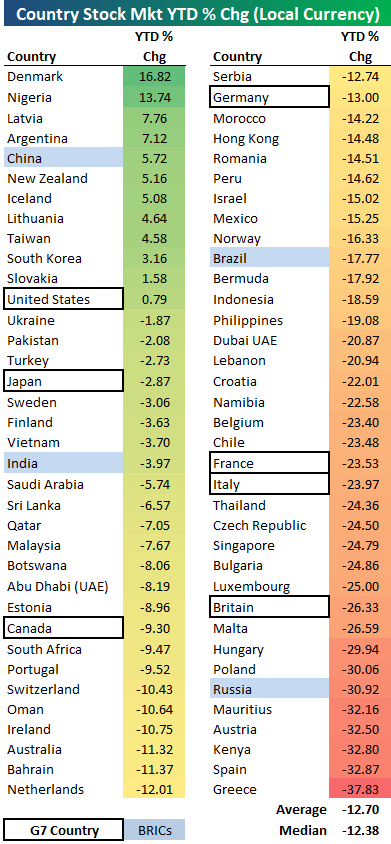
Equity markets around the globe had been hanging in there up until early September, but since then we’ve seen a sell-off that has left global equity indices down quite a bit year-to-date. Below is a table showing the year-to-date performance (in local currency) of major equity indices for 72 countries. As shown, the average country is currently down 12.7% year-to-date, while the median decline is 12.38%. Of the 72 countries, only 12 are currently in the green for the year, while the remaining 60 are in the red.
Denmark’s equity market is currently up the most with a YTD gain of 16.82%, followed by Nigeria at +13.74% and Latvia at 7.76%. China ranks fifth with a gain of 5.72%, while the US (S&P 500) is now just barely hanging on to a YTD gain at +0.79%.
The remaining G7 countries are performing quite a bit worse than the US. While Japan is only off 2.87% on the year, the big European countries like the UK, Italy, and France are all down more than 23%. The UK is down the most in the G7 with a decline of 26.33%.
Of the four BRIC countries, China is doing the best, while India is down 3.97%, Brazil is down 17.77%, and Russia is down 30.92%.
Seven countries are currently down more than 30% year-to-date — Poland, Russia, Mauritius, Austria, Kenya, Spain, and Greece. Greece is currently down more than any other country with a YTD loss of 37.83%.

Comments
Log in or sign up to join the conversation.