

First I would like to apologize for the short Weekend Report today as it was a very busy day for me. I will have many more charts to show you tomorrow night as the markets will be closed.
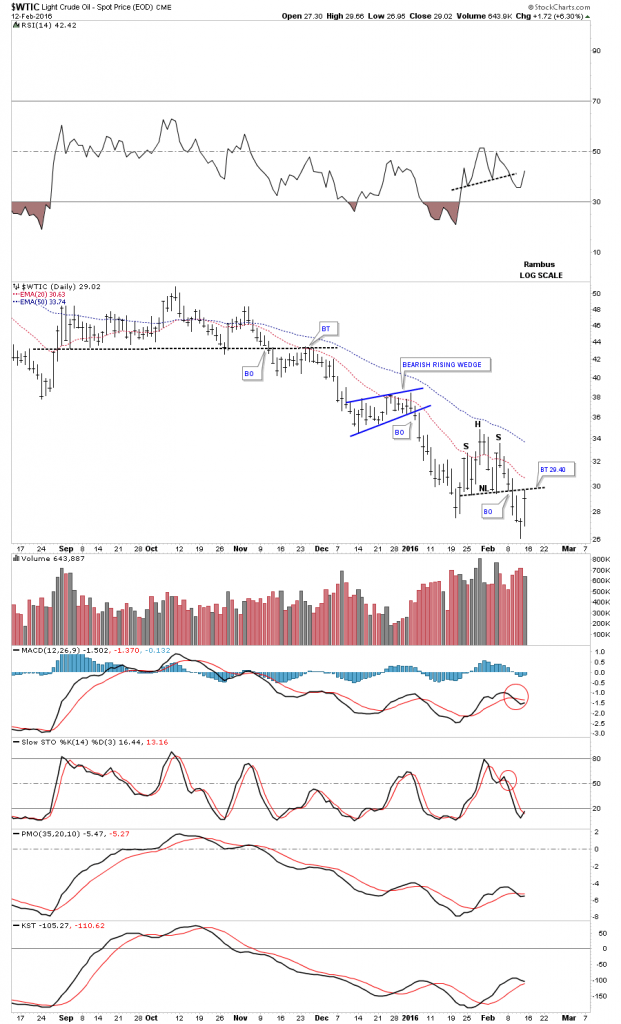
The first chart I would like to show you is the short term $WTIC chart which shows the small H&S consolidation pattern in place. Last Tuesday it broke below the neckline and Friday it backtested the neckline from below at 29.66. The neckline is a very fine line in the sand in which I’ll use to exit the DWTI trade if the price action starts trading above it.
(Click on image to enlarge)
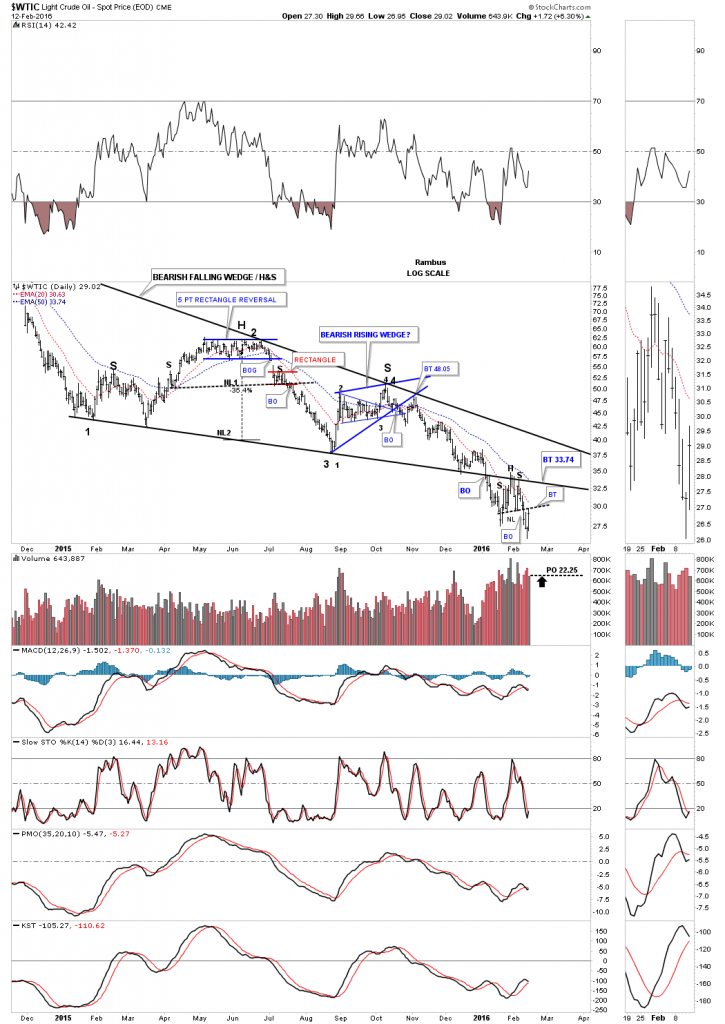
Below is the long term daily chart which shows the combo H&S / falling wedge consolidation pattern. As you can see the small H&S consolidation pattern on the daily chart above is the backtest to the bottom rail of the falling wedge / neckline.
(Click on image to enlarge)
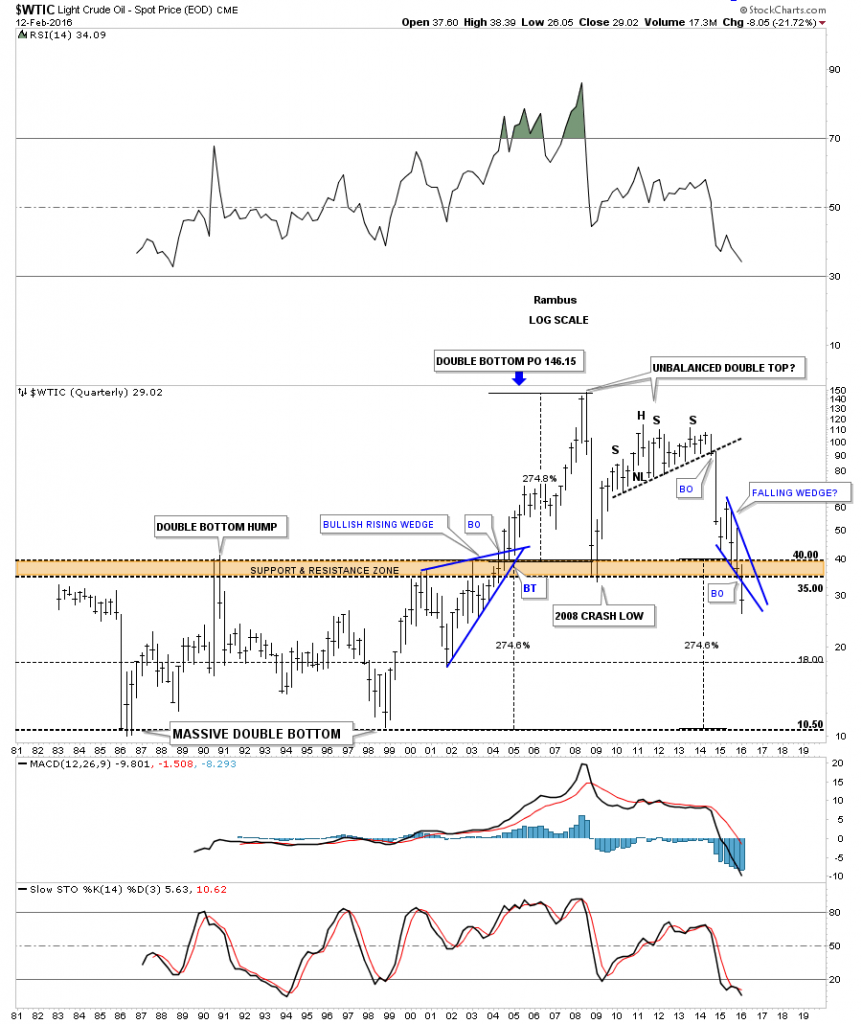
The long term quarterly chart for oil shows the reverse symmetry blue wedges that formed, one on the way up and our current one that has just broken down. It’s impossible to know if oil is going to reverse symmetry all the way down to the its all time lows around the 10.50 area but the possibility is there but hard to imagine.
(Click on image to enlarge)
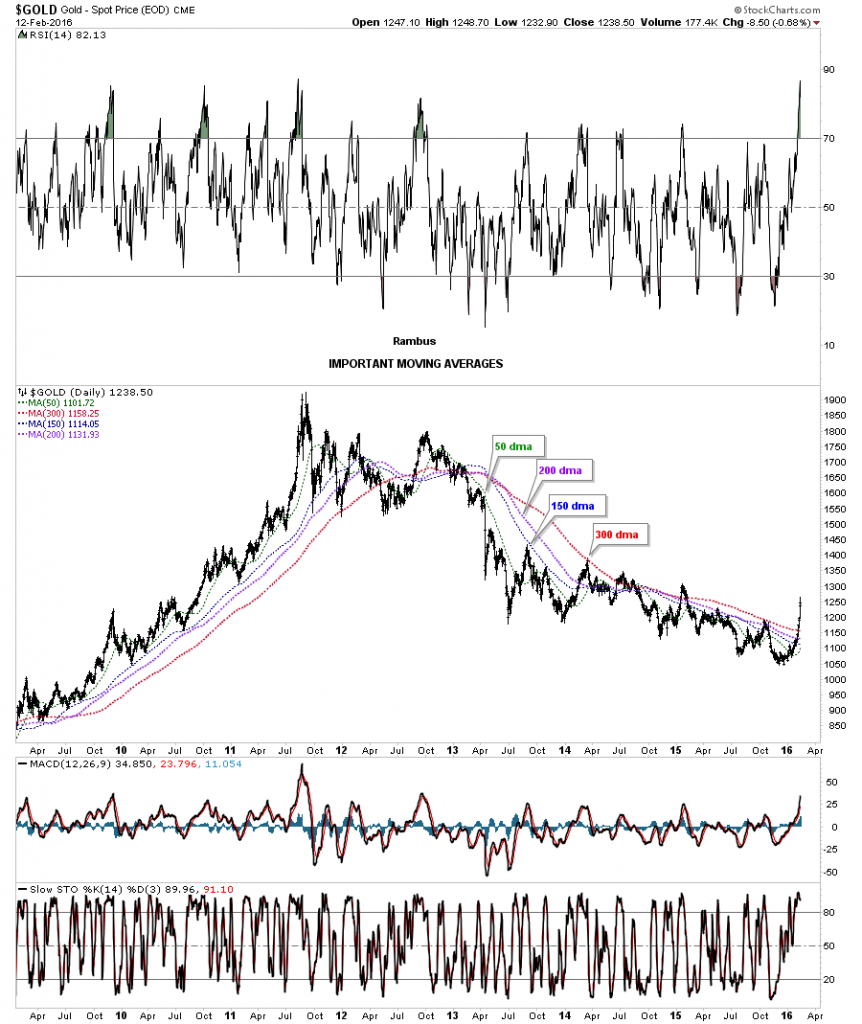
This next chart is the very long term daily chart for gold which is the all important moving averages chart we’ve been following. The last time I posted this chart gold it was still trading under the 150 day moving average I believe. I said at the time that gold would have to show its hand by trading above the 300 day moving average which it has done. It’s now trading at the highest point above the 300 day ma since the bear market really took off to the downside back in 2013. It now comes in at 1158 which is about 80 points lower. That’s a pretty substantial breakout above the 300 dma.
(Click on image to enlarge)
This next chart is a combo chart which focuses in on the HUI in the middle and gold on the bottom which we began watching last year. As you can see the last two weeks have made a dramatic impact on the HUI and gold charts. I still remember putting that question mark on the 9th reversal point on the gold chart thinking, is it going to put in another reversal point to the upside, as I was thinking the falling wedge was finally going to break to the downside. The charts don’t care what I think as gold broke to the upside last week.
(Click on image to enlarge)
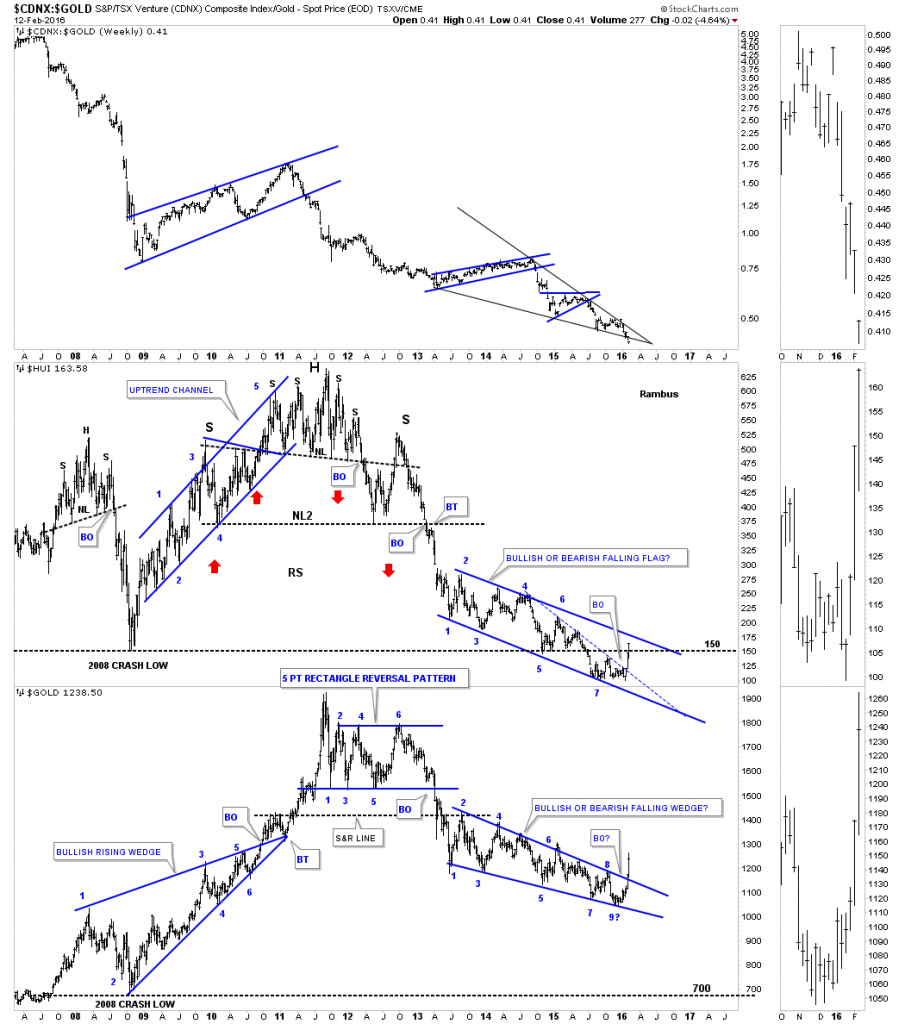
There are many ways in which to draw in the top and bottom trendlines for the 2 1/2 year trading range in gold. I could make a case for a falling wedge pattern but right now the cleanest chart pattern for this very long 2 1/2 year trading range is a parallel downtrend channel. This potential pattern is just coming to light after the big rally since the beginning of the year. As you can see by the small red circles that the price action doesn’treach the top or bottom trendlines in some cases. If I started the top rail from the fourth reversal point I would get a falling wedge instead of a parallel downtrend channel. The high this past week was 1264 which is now a critical number to keep a close eye on. Gold is also trading well above the 65 week ma.
(Click on image to enlarge)
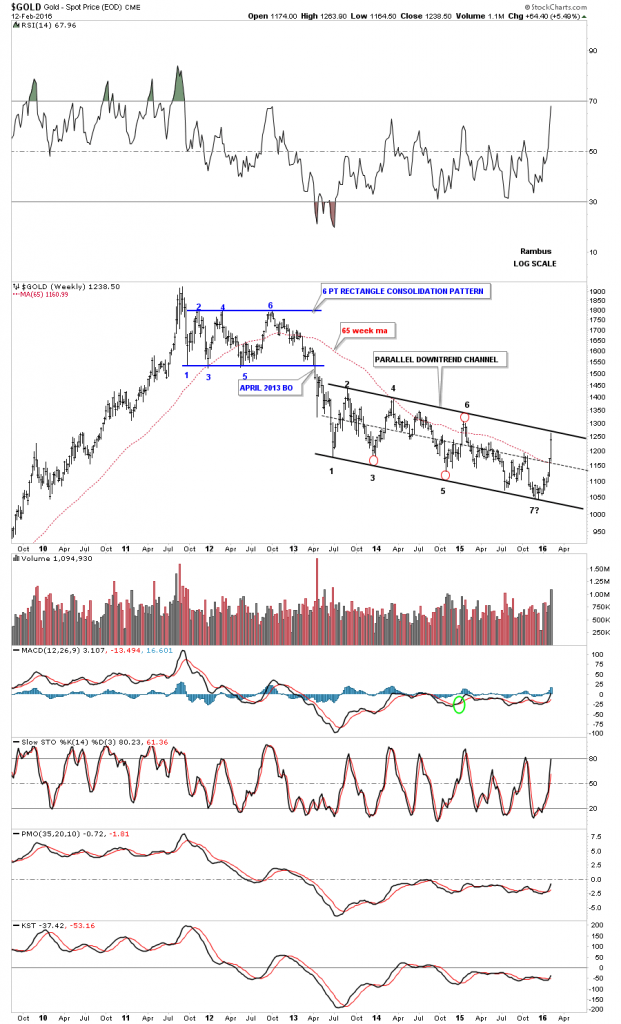
This long term monthly chart puts the falling channel, from the weekly chart above, in perspective. If gold can close out the month of February with a nice big white candlestick above the top rail of the parallel downtrend channel that would be very bullish as the next area of resistance would be the top rail of the black expanding falling wedge. I’ve always viewed the black expanding falling wedge as a halfway pattern to the upside.
(Click on image to enlarge)
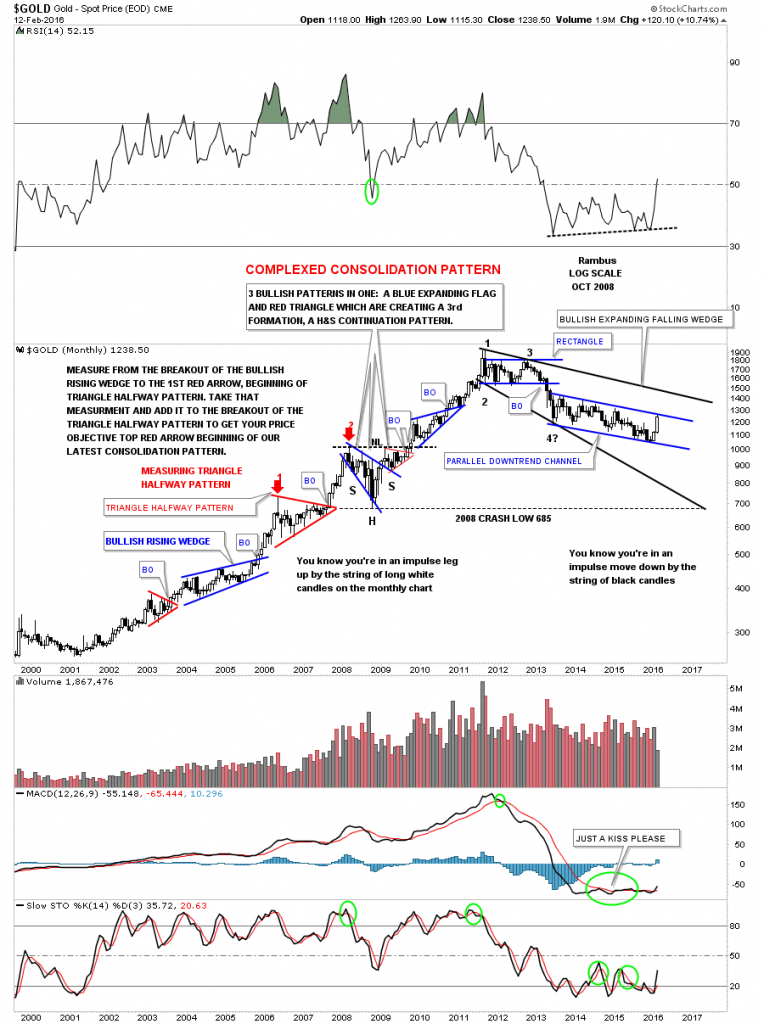
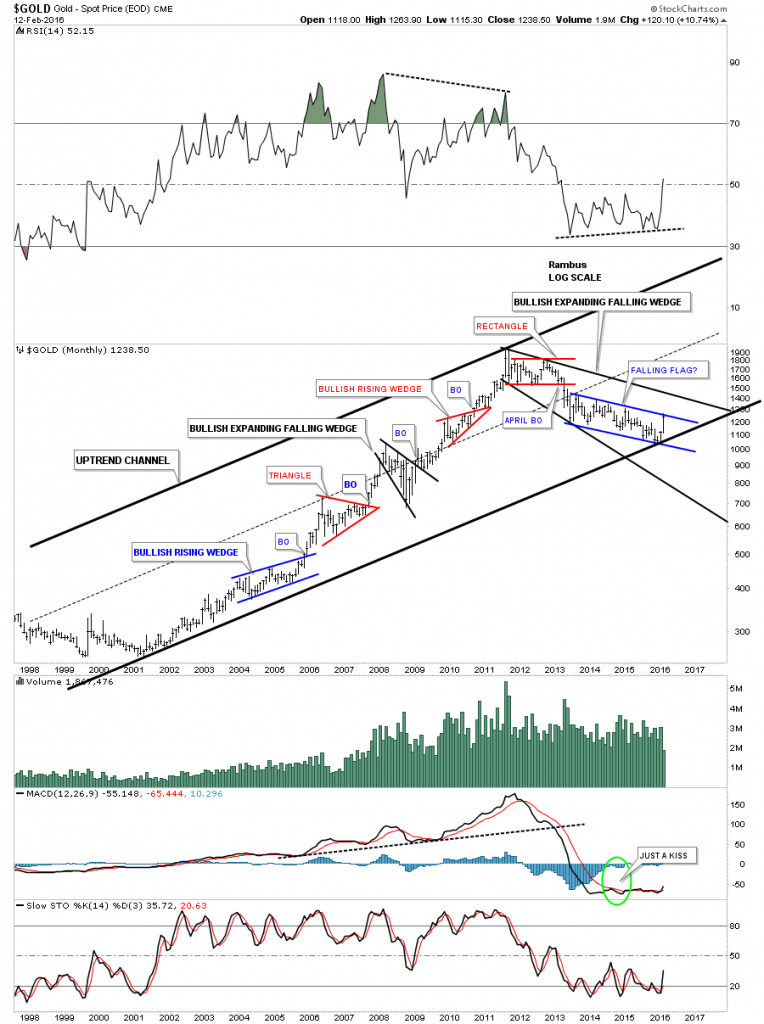
This last chart for tonight is a brand new chart I’ve never posted before. I’ll let the chart speak for itself. I will have another post tomorrow with many more charts to look at. For those who have someone special in their lives I hope you had a happy Valentines Day. All the best…Rambus
(Click on image to enlarge)



Comments
Log in or sign up to join the conversation.