

After yesterday’s hard decline in the PM stock indexes, the price action has now spent two full days below the top of the trading range, trading in no man’s land. With the short term being so important to understand right now, we’ll focus mostly on the shorter-term charts to try and decipher what they are telling us.
Let’s start with the CDNX, which has held up pretty well and is showing some short-term relative strength. This first daily chart shows the October 16th high, which began the correction. If you recall, the price action formed the H&S consolidation pattern, which led to the measured move price objective up to the 1130 area, which led to the most recent decline.
During the decline, the CDNX formed a double bottom reversal pattern on the neckline extension line, which led to the current rally. During Tuesday’s decline, support was found on the double bottom trend line, which now becomes important support around the 1035 area.
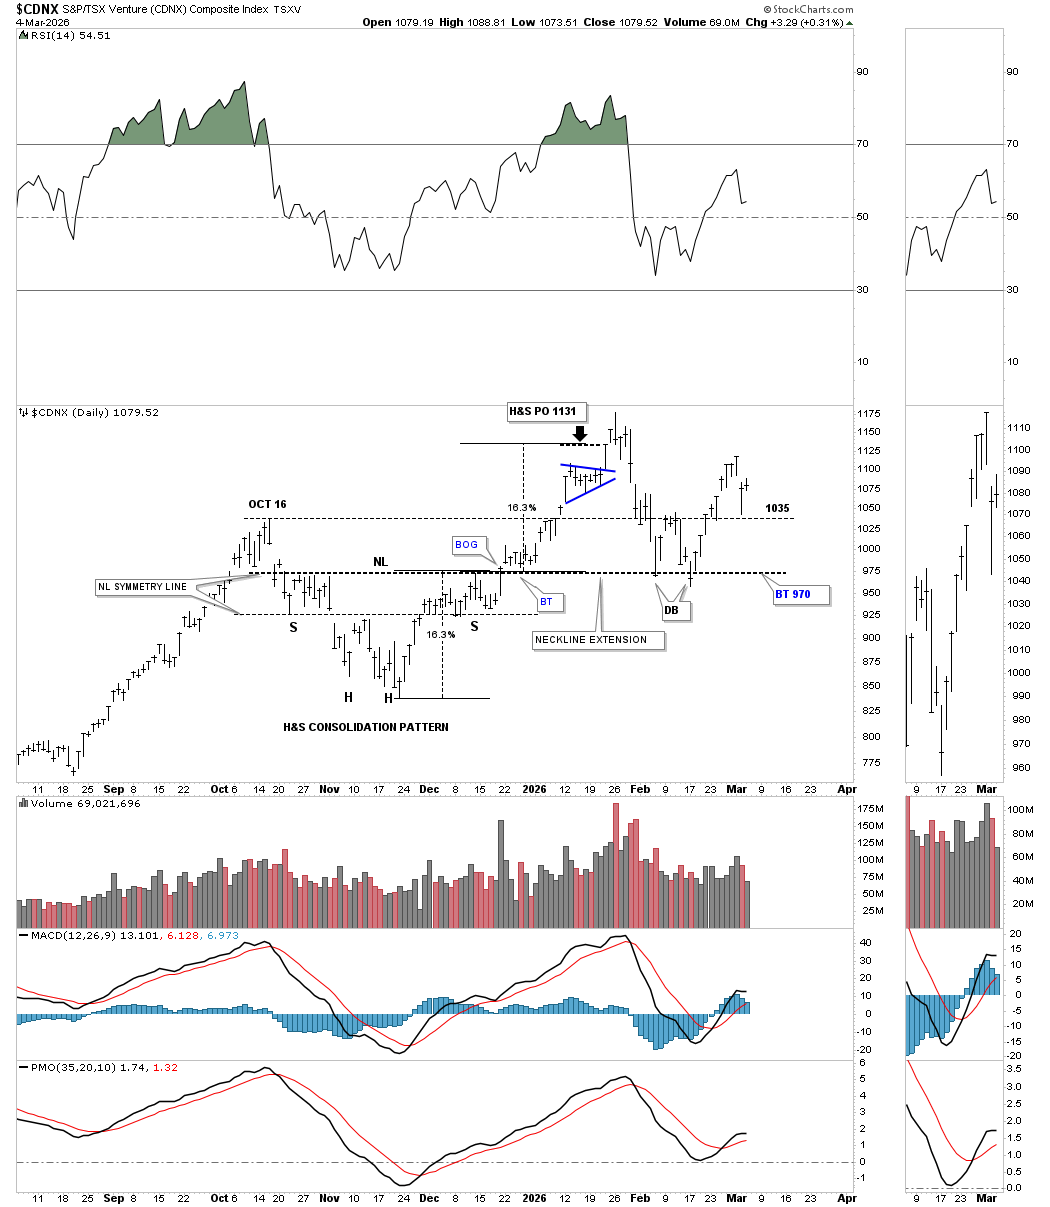
I had mentioned that if the double bottom held, there was a possible rising wedge forming, with the double bottom forming at the possible 4th reversal point.


Comments
Log in or sign up to join the conversation.