

Cisco SystemsInc., Elliott Wave Technical Analysis
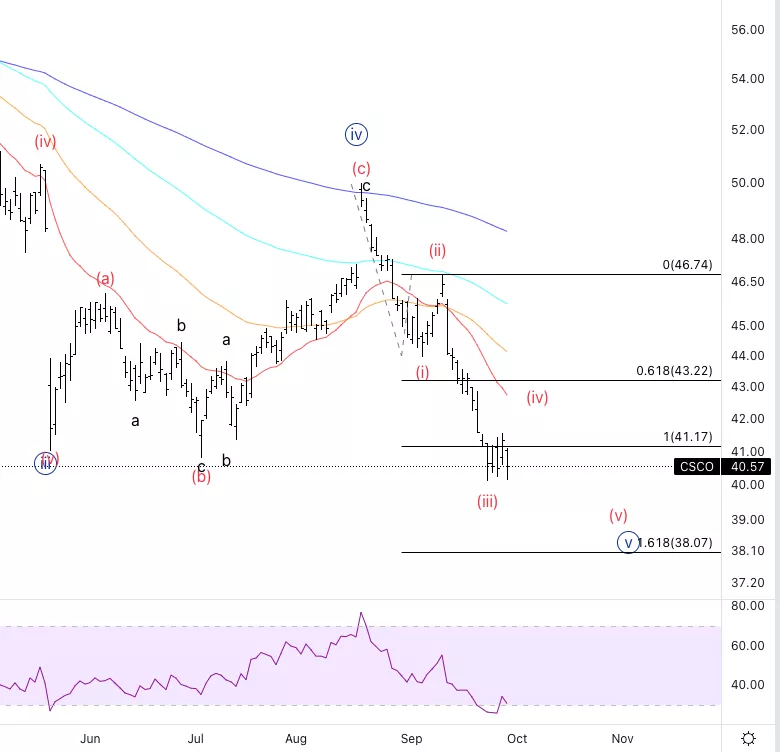
Cisco Systems Inc.,(CSCO): Daily Chart, September 30 2022,
CSCO Stock Market Analysis: We could be forming wave (iv) and I would expect it to be sideways as wave (ii) was a sharp correction.
CSCO Elliott Wave count: (iv) of {v}.
CSCO Trading Strategy: Looking for short off wave (iv) once we get confirmation.
CSCO Technical Indicators: Eventually the 20EMA(red line) 9could act as resistance.
(Click on image to enlarge)
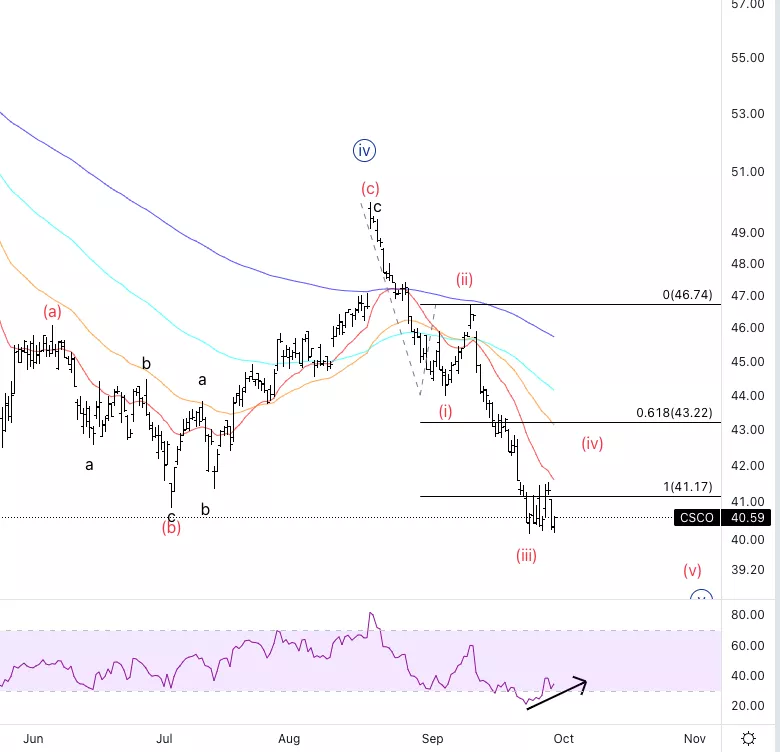
Cisco Systems Inc., CSCO: 4-hour Chart, September 30 2022
Cisco Systems Inc., Elliott Wave Technical Analysis
CSCO Stock Market Analysis: We can see we past equality of (i) vs(iii) and now we are facing resistance at the same level.
CSCO Elliott Wave count: (iv) of {v}.
CSCO Technical Indicators: We are starting to form RSI divergence.
CSCO Trading Strategy: Looking for shorts once we have confirmation wave (iv) is completed.
(Click on image to enlarge)
More By This Author:
SP500 Elliott Wave Analysis - Wave (v) Of C) Of 4 Of (1)
Elliott Wave Technical Analysis: Binance Coin, Sept. 29
Elliott Wave Technical Analysis: PayPal Holdings Inc., Sept. 29



Comments
Log in or sign up to join the conversation.