

On May 5, 2021, I posted on social media: “CHF/JPY -- as long as price stays above 119.26, the pair will move higher towards the 120.50 area. I will be watching for buying opportunities,” and “Watch for CHF/JPY buy signal on the break above 119.76 level, with stops at 119.26 targeting the 120.26 – 120.50 area.”
On May 7, I also posted on social media about a second buy entry: “CHF/JPY -- added second long/buy signal at 120.30, with Stop Loss at 120.03 targeting the 120.57-120.71 area.”
In the chart below, several clear bullish market patterns were visible, which allowed me to be confident in calling the CHF/JPY buy signals. There was a bullish inverted head-and-shoulders pattern, illustrated in dark blue, which triggered buy signals on the break above the pattern neck line. On May 5, I posted the first buy entry (green) on the break above the pattern neck line at 119.76.
The price broke above the neck line and then was followed by a pullback. Pullbacks found support at the support/resistance zone (pink) and the price bounced higher off this zone, which then formed another bullish pattern (light blue). The support/resistance zone (pink) combined with the bullish pattern (light blue) and the bullish divergence forming in the support zone was all I needed to be confident on posting the second long/buy trade setup (purple) for a move higher.
CHF/JPY 30-Minute Chart: May 9, 2021
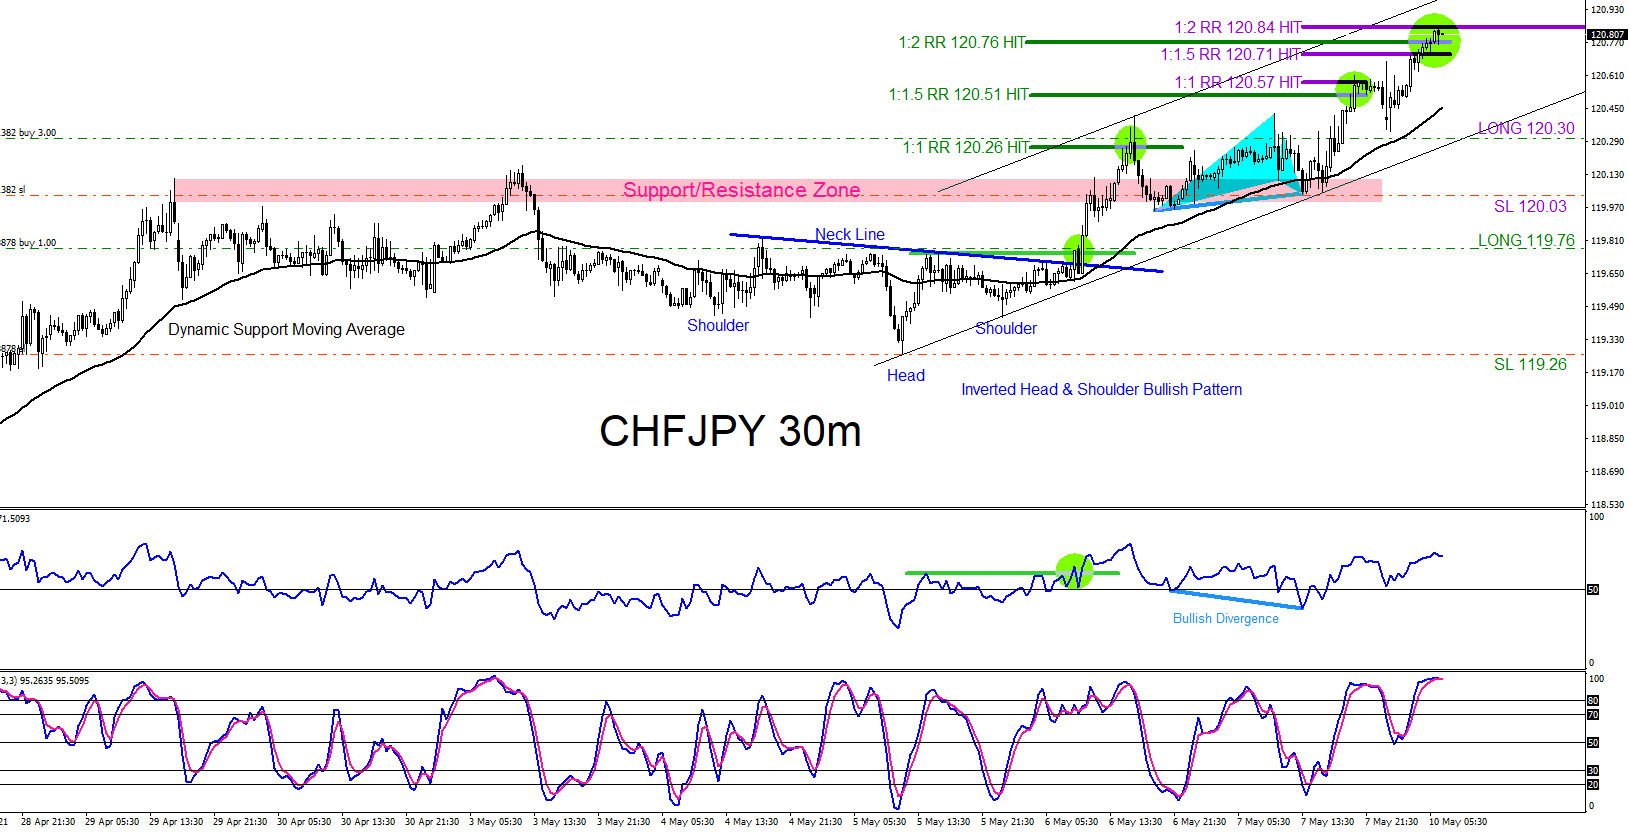
CHF/JPY hit the first buy entry (green) 1:2 RR target at 120.76 from 119.76 for +100 pips, and the second buy entry (purple) 1:2 RR target at 120.84 from 120.30 for +54 pips.



Comments
Log in or sign up to join the conversation.