

Key Takeaways
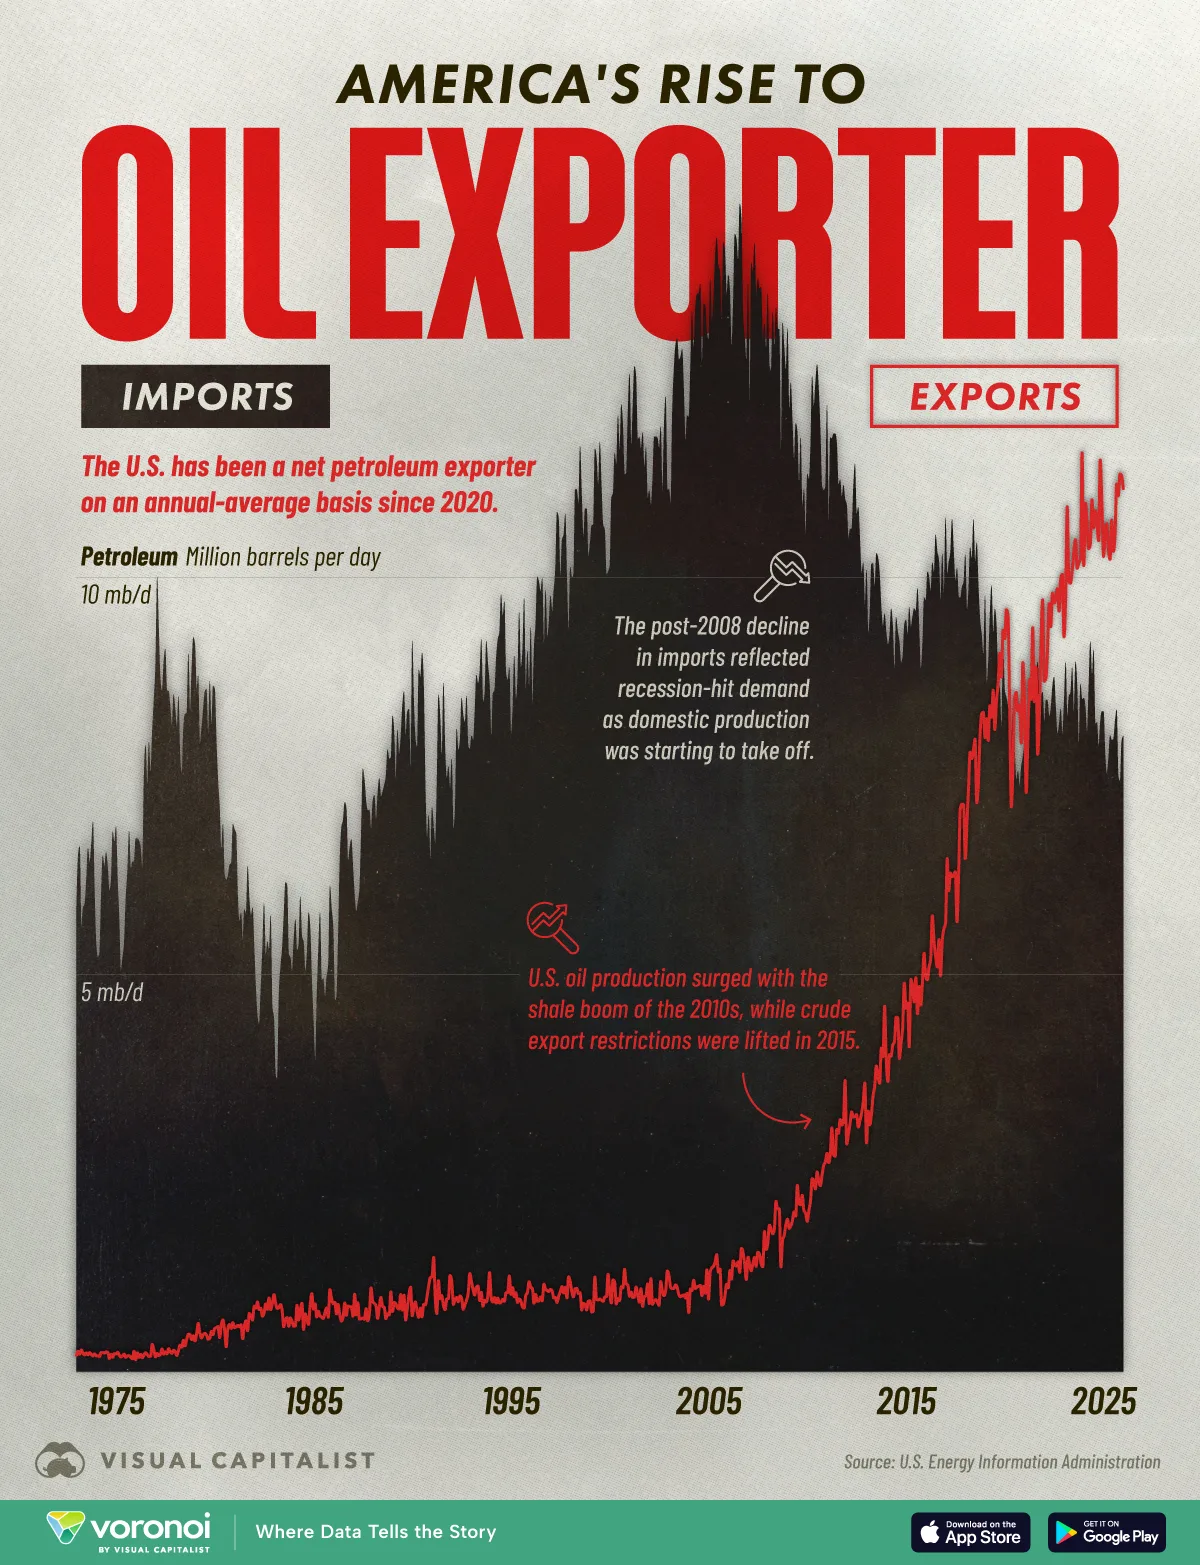
The U.S. has been a net petroleum exporter since 2020, reversing decades of reliance on imports.
In 2025, the gap widened to 2.8 million barrels per day.
Oil imports once peaked at nearly 15 million barrels per day in 2005.
As recently as the mid-2000s, the U.S. was importing vast amounts of oil to meet domestic demand. Today, it exports more petroleum than it imports, marking a dramatic reversal in U.S. energy trade.
This chart tracks U.S. oil imports and exports since 1973 based on data from the Energy Information Administration (EIA). It shows how the country moved from a major importer to a net exporter after decades of dependence on foreign supply.
The crossover came in 2020, when U.S. petroleum exports exceeded imports for the first time since at least 1949.
When the U.S. Relied on Oil Imports
Historically, the U.S. has been a massive oil importer, driven by its industrial needs and high household consumption as a car-dependent country.
The early 1970s famously saw the U.S. impacted by an energy crisis following an oil embargo by major oil-producing states such as Saudi Arabia. American policymakers came to understand the dangers of oil dependence on foreign producers, contributing to large-scale exploration efforts and the imposition of a ban on crude oil exports without a permit.
The data table below shows U.S. monthly oil imports, exports, and net imports in thousands of barrels per day (kbd) from 1973 to January 2026.
10152550100entries per page
Search:
Year | Petroleum Imports (kbd) | Petroleum Exports (kbd) | Petroleum Net Imports (kbd) |
|---|---|---|---|
1973 | 6257.614 | 231.539 | 6026.075 |
1974 | 6106.949 | 220.265 | 5886.684 |
1975 | 6055.197 | 209.565 | 5845.632 |
1976 | 7311.529 | 223.28 | 7088.249 |
1977 | 8814.514 | 242.658 | 8571.856 |
1978 | 8362.208 | 361.029 | 8001.178 |
1979 | 8453.347 | 470.964 | 7982.384 |
1980 | 6911.935 | 544.532 | 6367.402 |
1981 | 5999.857 | 593.926 | 5405.931 |
1982 | 5111.942 | 814.49 | 4297.453 |
1983 | 5043.856 | 740.314 | 4303.542 |
1984 | 5438.21 | 721.176 | 4717.033 |
1985 | 5060.696 | 782.09 | 4278.606 |
1986 | 6213.924 | 785.022 | 5428.903 |
1987 | 6672.683 | 765.416 | 5907.267 |
1988 | 7401.561 | 815.046 | 6586.514 |
1989 | 8060.731 | 858.868 | 7201.864 |
1990 | 8017.638 | 856.542 | 7161.096 |
1991 | 7622.212 | 1002.777 | 6619.435 |
1992 | 7883.437 | 948.991 | 6934.447 |
1993 | 8616.414 | 1002.479 | 7613.935 |
1994 | 8994.387 | 941.311 | 8053.076 |
1995 | 8834.999 | 949.963 | 7885.036 |
1996 | 9472.205 | 981.164 | 8491.041 |
1997 | 10158.571 | 1003.038 | 9155.533 |
1998 | 10703.784 | 944.744 | 9759.04 |
1999 | 10850.785 | 938.782 | 9912.002 |
2000 | 11459.382 | 1039.443 | 10419.939 |
2001 | 11870.427 | 970.794 | 10899.632 |
2002 | 11527.177 | 984.977 | 10542.2 |
2003 | 12256.572 | 1026.663 | 11229.91 |
2004 | 13142.334 | 1048.12 | 12094.213 |
2005 | 13714.677 | 1165.508 | 12549.168 |
2006 | 13706.889 | 1317.28 | 12389.609 |
2007 | 13458.883 | 1432.116 | 12026.767 |
2008 | 12912.598 | 1801.117 | 11111.481 |
2009 | 11693.961 | 2022.106 | 9671.856 |
2010 | 11790.625 | 2350.714 | 9439.911 |
2011 | 11430.549 | 2983.525 | 8447.024 |
2012 | 10598.179 | 3204.324 | 7393.856 |
2013 | 9854.258 | 3618.423 | 6235.835 |
2014 | 9239.236 | 4170.894 | 5068.342 |
2015 | 9446.34 | 4738.298 | 4708.042 |
2016 | 10055.718 | 5260.039 | 4795.679 |
2017 | 10142.516 | 6377.687 | 3764.829 |
2018 | 9941.025 | 7598.088 | 2342.936 |
2019 | 9134.983 | 8470.696 | 664.287 |
2020 | 7864.611 | 8498.974 | -634.363 |
2021 | 8470.182 | 8528.14 | -57.958 |
2022 | 8329.658 | 9516.77 | -1187.112 |
2023 | 8530.77 | 10229.419 | -1698.649 |
2024 | 8437.117 | 10711.516 | -2274.399 |
2025 | 7885.292 | 10702.822 | -2817.53 |
2026 (incl. Jan. only) | 8004.452 | 11114.258 | -3109.806 |
Oil imports peaked in 2005 at nearly 15 million barrels per day, at a time when domestic oil production was far outstripped by demand. Key import markets included Canada, Saudi Arabia, and Venezuela.
The Shale Boom That Changed the Balance
The late 2000s and early 2010s marked a turning point in the U.S. energy trajectory. Demand was softened by the 2008 recession and global financial crisis, while domestic production began to take off with a shale oil boom and new oilfield discoveries in states like North Dakota.
Steadily growing production led the U.S. to repeal its longstanding ban on oil exports in 2015, setting the stage for the country to boost production and compete globally with other major players such as Russia and Saudi Arabia.
Notably, at the time of repeal oil imports made up roughly a third of total consumption, down from its peak of approximately 60% in 2005.
The U.S. as a Global Exporter
Contrary to small petrostates such as those seen in the Persian Gulf, the U.S. has a large, powerful, and diversified economy of which oil exports make up only a small portion.
However, the shift of the U.S. from a net importer to becoming a net exporter has reshaped global energy markets, as the country surpassed Russia and Saudi Arabia to become the world’s top crude oil producer in the late 2010s.
Rising U.S. production has reduced reliance on foreign oil and reshaped global energy flows. Today, oil and gas form key components of the economies of states like Texas, New Mexico, and North Dakota.

Comments
Log in or sign up to join the conversation.