
With the war with Iran looking increasingly as a non issue for investors (nor was it ever really an issue, as noted in my two prior posts here and here), it's time to take stock of the state of US equities with a quick look at the Mega Trend* and where it stands today.
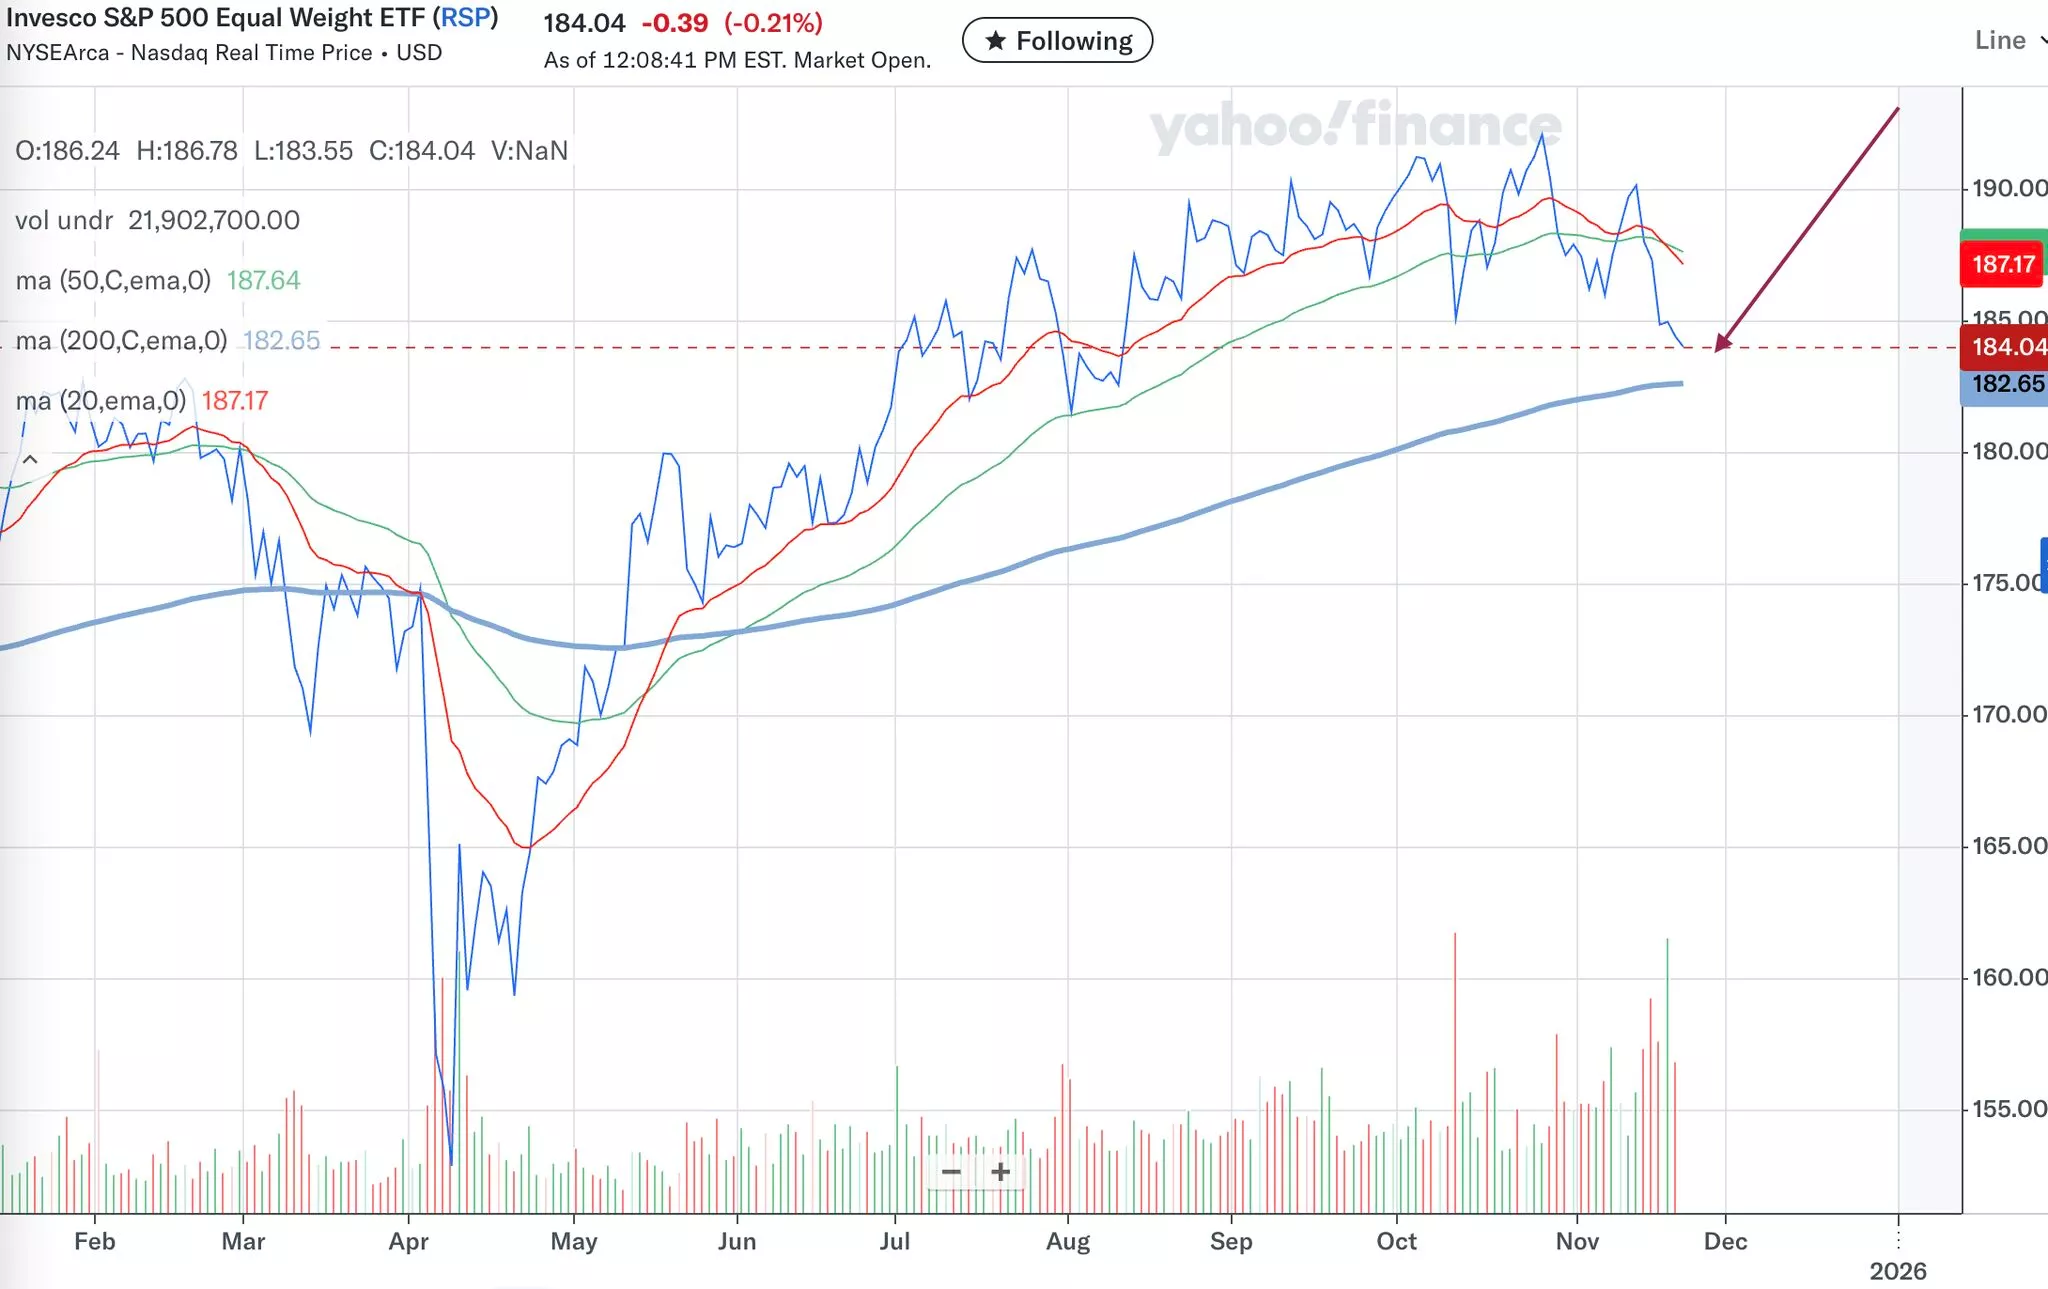
As the accompanying chart shows, solidly bullish is the state of affairs for large cap US equities** with price above its major moving averages, the shorter-term 50 day moving average above its 200 day brethren AND (importantly) the slopes of the moving averages are up.
Over the past 3 years there was one trend reversal signal generated in December 2018 (from bull to bear) but that was dispensed within the requisite time period (3 months) when such signals typically are negated which, in this case, was produced by the Fed carpet bombing the economy and financial markets with more money. As noted in recent postings, unless and until there are clear impacts to the financial and valuation models that pro investors can justifiably act upon, the market manifestation of this reality is the Mega Trend, which is supportively bullish.
*see prior posts re definition and application.
**the same case applies to US mid and small cap as well as many other global equity markets.


Comments
Log in or sign up to join the conversation.