

California's economy took a pretty big hit in 2017. Specifically, it appears to have taken a pretty big hit in the first quarter of the year, after which it appears to have slowly recovered at real growth rates that are slower than what the domestic U.S. economy has seen as a whole. The following chart shows the BEA's estimated GDP for California in the period from the first quarter of 2016 through the just-released preliminary data for the third quarter of 2017.
(Click on image to enlarge)
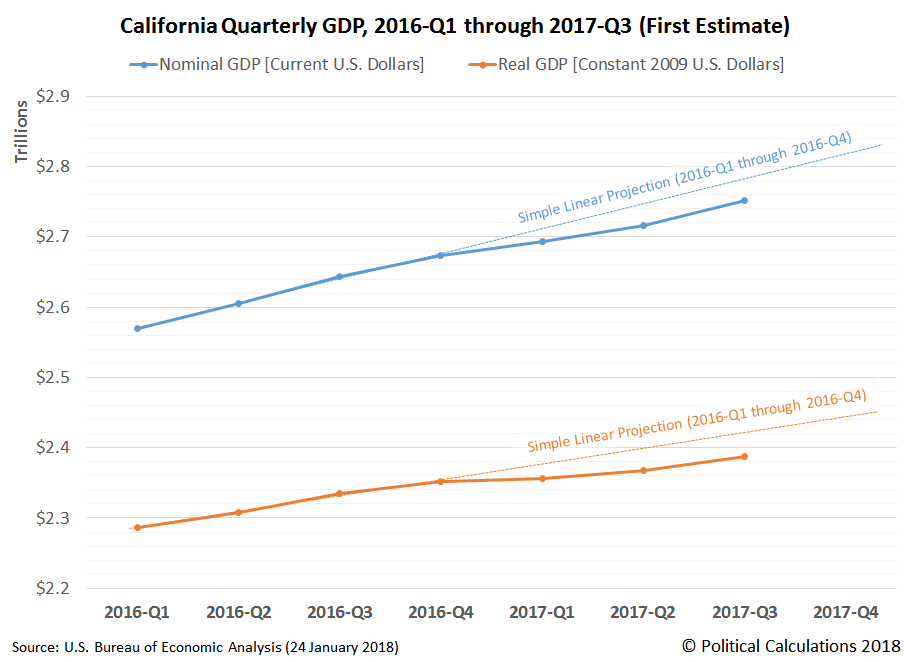
In the chart above, we've used simple linear projections to illustrate the extent to which California's nominal and inflation-adjusted gross domestic products in 2017 are falling below their 2016 trends. Although the slowing trend really began in 2016-Q4, as you can see, most of that gap between previous trend and actual performance opened up in 2017-Q1, when California's economy appears to have stagnated. Since then, the gap has continued to persist through 2017-Q3, even as the state's economic growth rate has rebounded.
Drilling down into the state level GDP data, we find that the most negatively affected industries in California in 2017-Q1 was its agricultural sector, followed by its finance and insurance industry, neither of which have recovered to the levels they were at the end of 2016. The same holds true to a lesser extent for the state's mining, construction, manufacturing and utility industries, which have also seen recessionary conditions in 2017. The state's manufacturing and finance and insurance industries have shown some signs of recovery in 2017-Q3.
Since the BEA's regional GDP data lags the current day by nearly four months, state officials seeking to respond in a timely manner to unexpected changes in the state's economy without foolishly waiting months or years for data revisions to be produced as some isolated academics with little-to-no real world leadership experience might desire can use the state's monthly employment data to get a more real-time picture of the state's economic situation in order to determine what actions they might need to take to avoid allowing any developing problems to needlessly escalate. The following chart shows California's trailing twelve month average labor force and employment levels as reported by the state's Employment Development Department, which shows the trends for both from January 2004 through December 2017.
(Click on image to enlarge)

In this second chart, we see that the growth of the size of California's labor force has been mostly stagnant in 2017. However, we see that after having been stagnant for most of 2017, the state's total employment level has picked up, particularly in the last three months of the year. Most of those increased number of jobs however appear to mostly be catching up with increases in California's population, where the state's labor force-to-population ratio shows a small decline, while the state's employment-to-population ratio has begun to recover after having declined into the third quarter of 2017. The overall effect for 2017 is flat however, as California's December 2017's employment-to-population ratio of 59.2% is the same as it was in January 2017.
(Click on image to enlarge)

Since this data is drawn from the California EDD's monthly report on California's demographic labor force, we can confirm that almost all of the improvement in the employment level is in the state's adult (Age 20+) population. California's teenagers are seeing a more dismal version of the state's employment situation, as can be seen in the following chart.
(Click on image to enlarge)

We anticipate that the employment situation for California's teens will be an interesting story to following in 2018. Typically, this portion of California's labor force has borne the brunt of the state's series of higher-than-federal minimum wage increases, which has harmed the employment prospects for this least educated, least skilled and least experienced portion of California's labor force. However, in 2018, the passage of the Tax Cuts and Jobs Act has permanently reduced the burden of federal corporate income taxes on businesses, where many will have more money available to pay higher wages to their employees, including those mandated by state and local governments, without necessarily forcing cuts elsewhere.
2018 could then be a year where the prospects for teen employment in a state that is hiking its minimum wage might improve, even in lackluster economic conditions, which would buck the typically negative pattern that we've seen whenever other mandated minimum wage hikes have taken effect without a similar corresponding boost to the cash position of businesses that employ minimum wage workers. We'll see how that might work in 2018!
Comments
Log in or sign up to join the conversation.