

On Jan. 10, 2022, I posted to social media: “CAD/JPY - Long/Buy signal at 91.06. Stop Loss set at 90.62. Aim to take profit at the 91.50-91.72 area.“
Confluence trading is a combination of two or more trading strategies/techniques that come together and form a high probability buy/sell zone in a certain area in the market.
Market patterns (Elliott Waves, Harmonic, Head and Shoulders, etc.), price action analysis (Support & Resistance, Supply & Demand Zones, Candlestick analysis, etc.), and indicators (RSI, Moving Average, Stochastic etc.) are technical strategies/techniques used when trading a confluence setup. The charts below show a confluence trade setup that signals a trader on which side to take the trade.
Buy Trade Setup
- RSI Indicator Bullish Trend Reversal Divergence (Pink).
- Price bounces off the Dynamic Support 200-MA (Black).
- RSI triggers a buy signal above the 50 level.
- MACD triggers a buy signal cross.
CAD/JPY: One-Hour Chart for Jan. 10, 2022
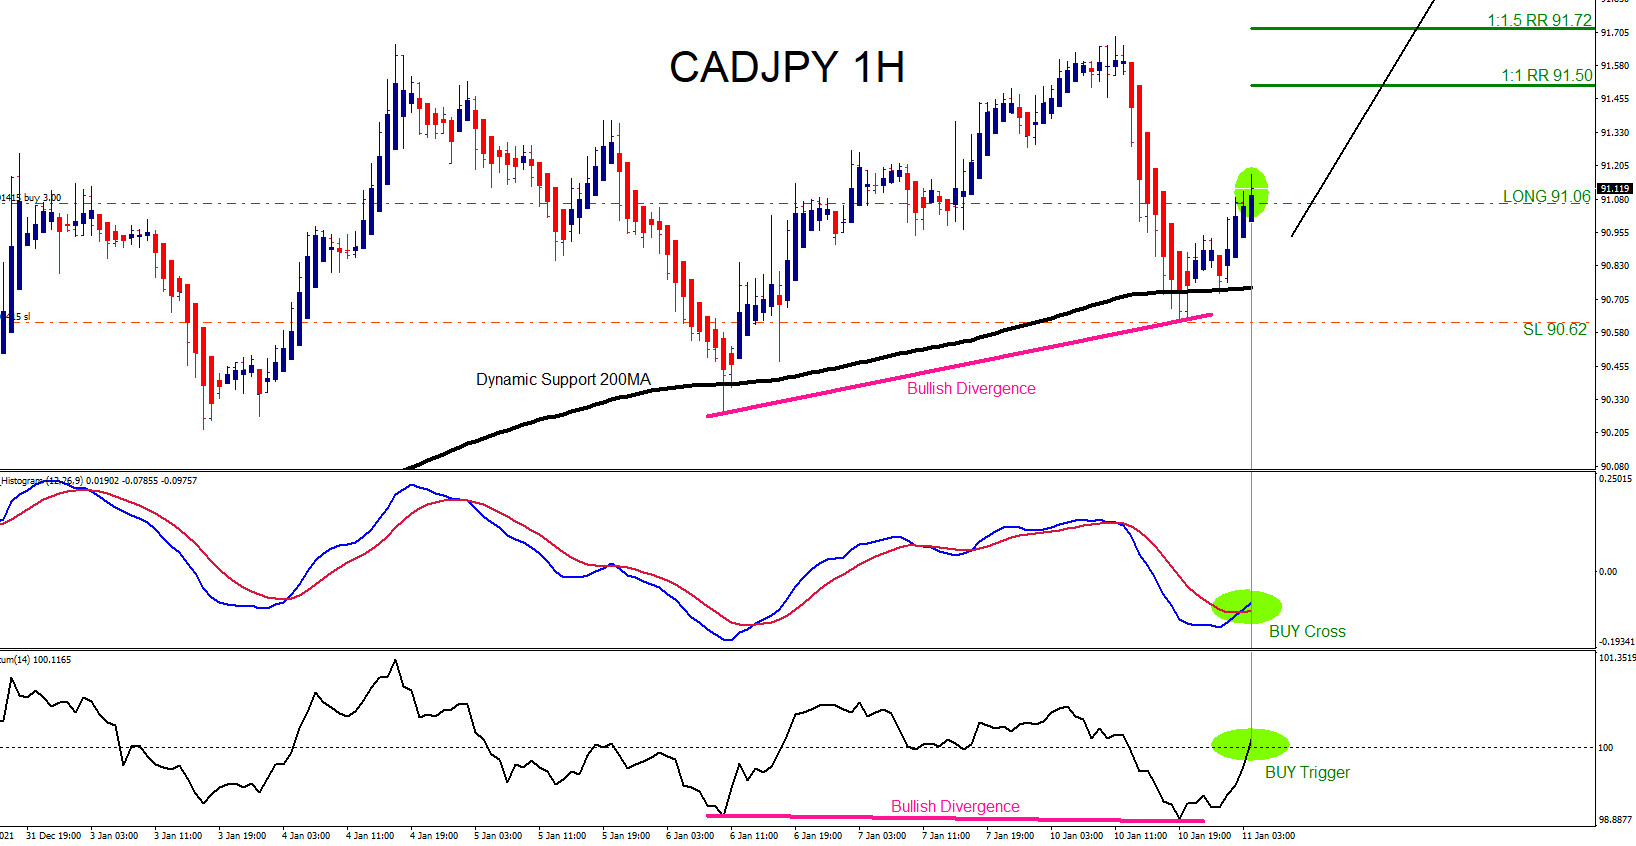
I entered the buy trade at 91.06 with a Stop Loss at 90.62 and targets at the 1:1 RR minimum, along with a full target at the 1:2 RR. The CAD/JPY pair moved higher, and on Jan. 12, 2022, the price hit 1:2 RR target at 91.94 from 91.06 for +88 pips (+2% gain risking 1% on every trade).
CAD/JPY: One-Hour for Jan. 12, 2022
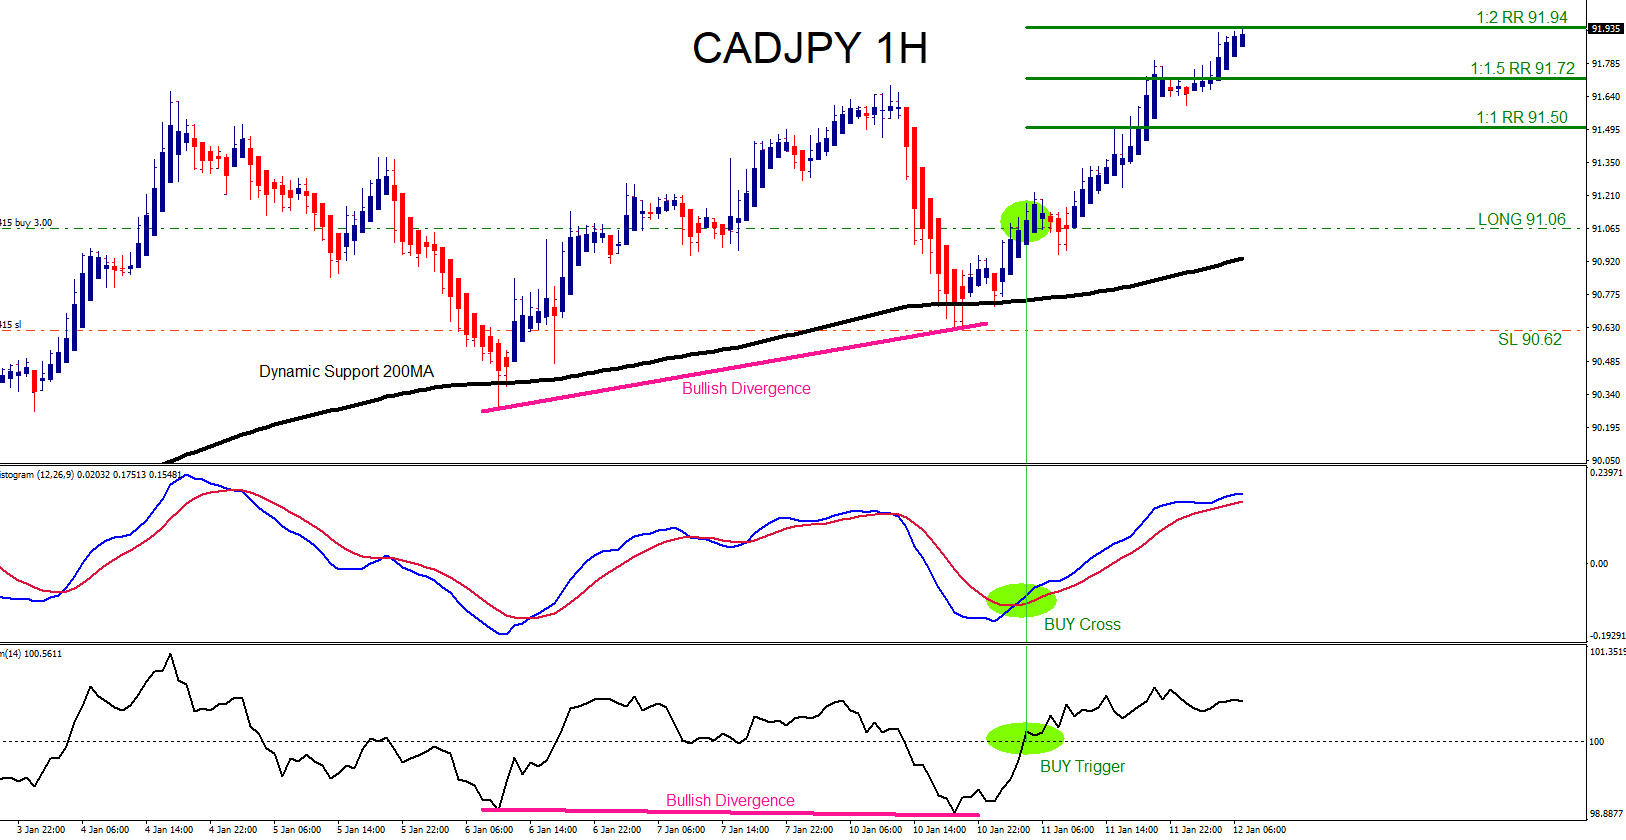
A trader should always have multiple strategies all lined up before entering a trade.



Comments
Log in or sign up to join the conversation.