

With industrial production for April released, we have a clearer picture of economic activity in that month. Here are some indicators followed by the NBER’s BCDC.
(Click on image to enlarge)
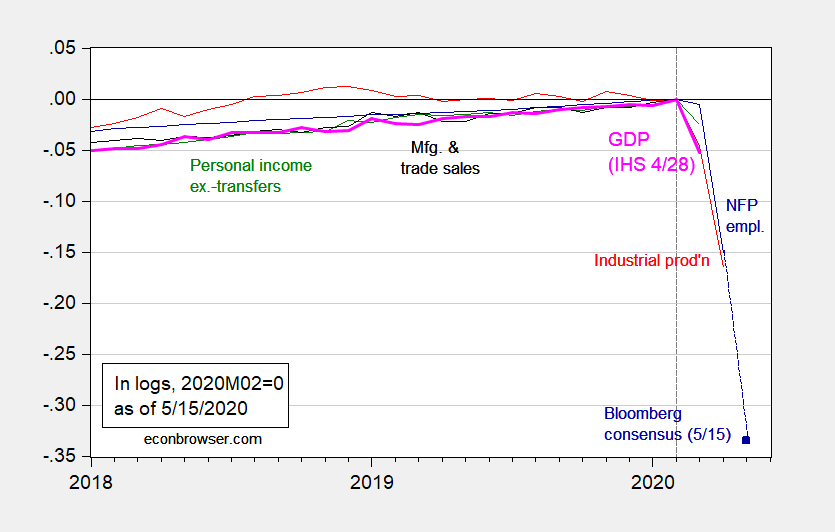
Figure 1: Nonfarm payroll employment (blue), industrial production (red), personal income excluding transfers in Ch.2012$ (green), manufacturing and trade sales in Ch.2012$ (black), and monthly GDP in Ch.2012$ (pink), all log normalized to 2019M02=0. Source: BLS, Federal Reserve, BEA, via FRED, Macroeconomic Advisers (4/28 release), and author’s calculations.
As of today, NY Fed, Atlanta Fed, and St. Louis Fed nowcasts for Q2 are -31.5%, -42.8%, and -48.07% (SAAR), respectively. IHS Markit is -39.5%. These nowcasts are a bit lower than the -32.3% mean forecast from the WSJ May survey (discussed here), and -32.2% mean forecast from the Q2 Survey of Professional Forecasters (released today).


Comments
Log in or sign up to join the conversation.