

Industrial production was released yesterday, along with retail sales.
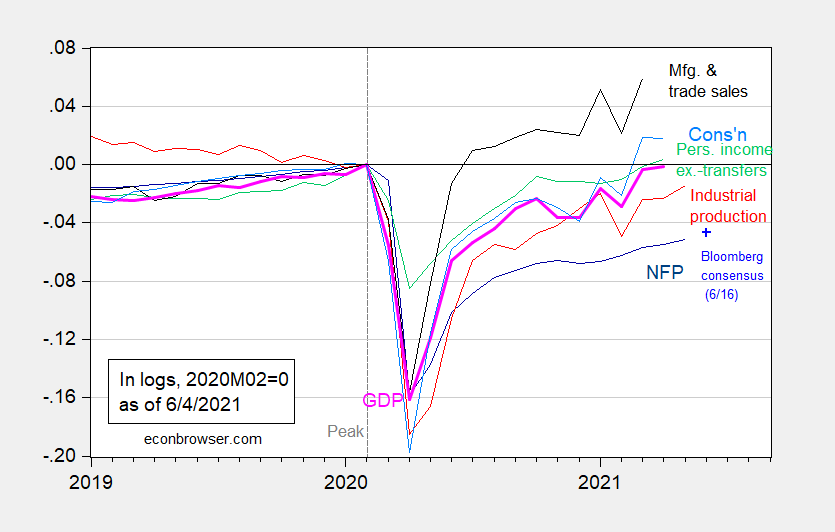
Figure 1: Nonfarm payroll employment from May release (dark blue), Bloomberg consensus as of 6/16 for June nonfarm payroll employment (light blue +), industrial production (red), personal income excluding transfers in Ch.2012$ (green), manufacturing and trade sales in Ch.2012$ (black), consumption in Ch.2012$ (light blue), and monthly GDP in Ch.2012$ (pink), all log normalized to 2020M02=0. Source: BLS, Federal Reserve, BEA, via FRED, IHS Markit (nee Macroeconomic Advisers) (6/1/2021 release), NBER, and author’s calculations.
Industrial production continued to rise in May, above Bloomberg consensus (0.8% vs. 0.6%), and at a slightly faster pace than recorded in the previous month. Manufacturing production also provided a similar upside surprise.
Retail sales pulled back slightly. after surging in the previous months. Retail sales might provide some insights into the trajectory of two of the series included in Figure 1 — manufacturing and trade industry sales, and consumption — but the fit is not extremely tight.
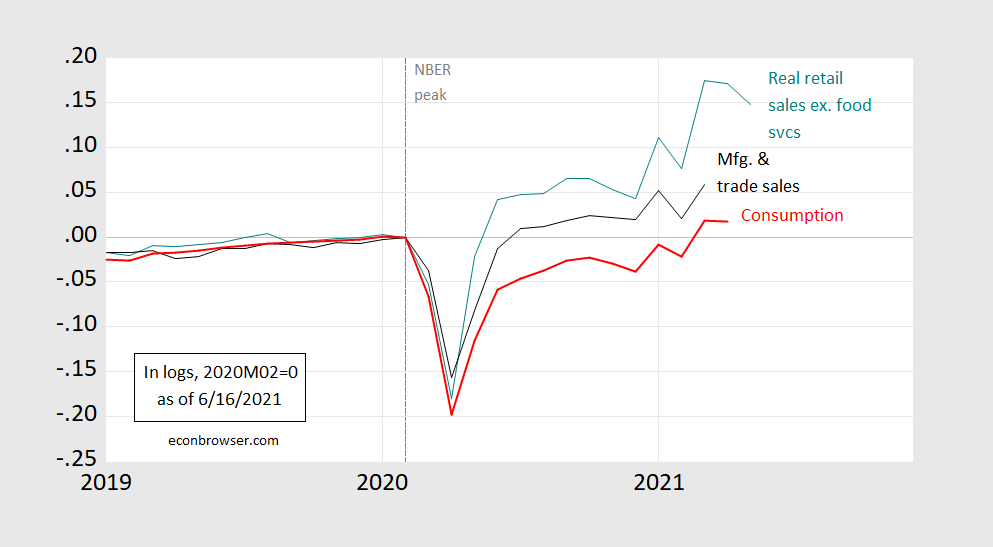
Figure 2: Retail sales excluding food services in 1982-84$ (teal), manufacturing and trade sales in 2012$ (black), and consumption in 2012$ (red), all in logs, 2020M02=0. Retail sales ex-food deflated using CPI-all. Source: Census, BEA, BLS, St. Louis Fed via FRED, and author’s calculations.
The latest observation for real manufacturing and trade sales is March, for consumption is April. Extrapolating with reference to retail sales, continued growth seems likely for the two series but hardly guaranteed.



Comments
Log in or sign up to join the conversation.