

Big positive numbers for growth — but remember the level matters.
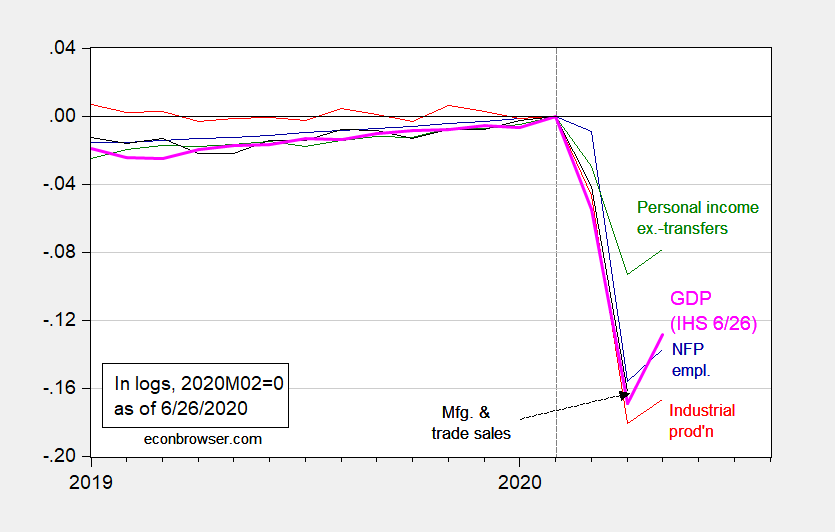
Figure 1: Nonfarm payroll employment (blue), industrial production (red), personal income excluding transfers in Ch.2012$ (green), manufacturing and trade sales in Ch.2012$ (black), and monthly GDP in Ch.2012$ (pink), all log normalized to 2019M02=0. Source: BLS, Federal Reserve, BEA, via FRED, Macroeconomic Advisers (6/26 release), Bloomberg, and author’s calculations.
Notice we don’t have manufacturing and trade sales through May, just through April. In fact, that number won’t be released until July 16th. However, we can guess for a substantial rebound in May, given the historical correlation between manufacturing and trade sales and retail sales ex.-food services.
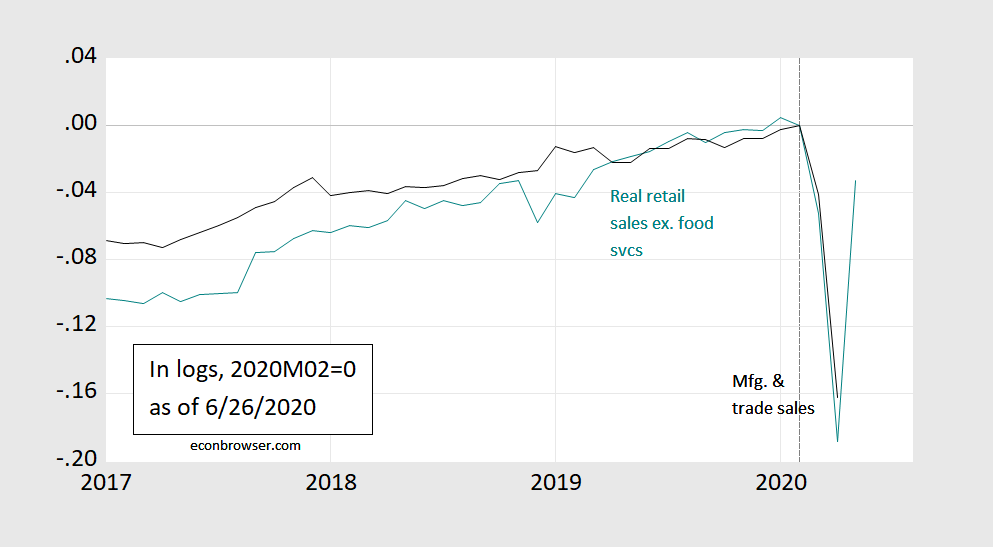
Figure 2: Manufacturing and trade sales in Ch.2012$ (black), and real (CPI-deflated) retail sales excluding food services, FRED series RSXFS (teal), all log normalized to 2019M02=0. Source: BLS, Census, BEA, via FRED, and author’s calculations.


Comments
Log in or sign up to join the conversation.