
With today’s employment situation release, here are five key indicators referenced by the NBER’s Business Cycle Dating Committee in Figure 1: Nonfarm payroll employment (blue), industrial production (red), personal income excluding transfers in Ch.2012$ (green), manufacturing and trade sales in Ch.2012$ (black), and monthly GDP in Ch.2012$ (pink), all log normalized to 2019M02=0.
(Click on image to enlarge)
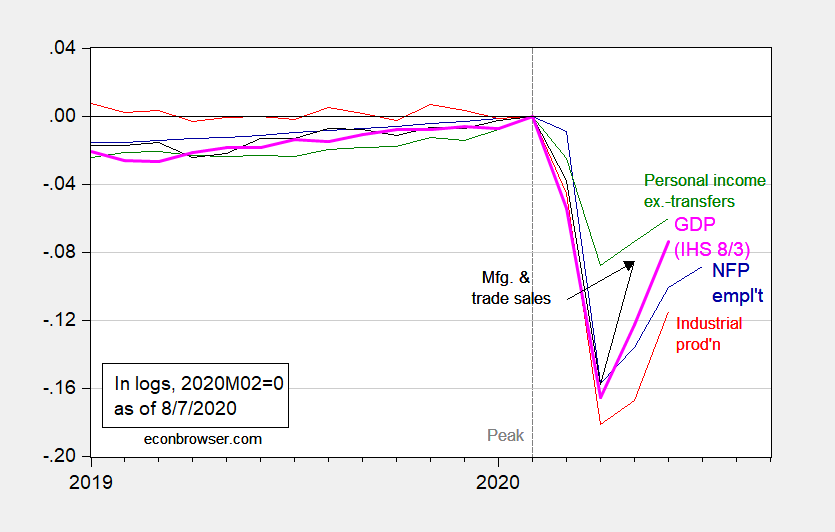
Figure 1: Nonfarm payroll employment (blue), industrial production (red), personal income excluding transfers in Ch.2012$ (green), manufacturing and trade sales in Ch.2012$ (black), and monthly GDP in Ch.2012$ (pink), all log normalized to 2019M02=0. Source: BLS, Federal Reserve, BEA, via FRED, Macroeconomic Advisers (8/3 release), NBER, and author’s calculations.
Since the graph is in log-deviations, one can read off the slope the growth rate. Nonfarm payroll employment has clearly decelerated substantially, matching pretty closely the Bloomberg consensus, and above the implied level gleaned from the Goldman Sachs employment tracker. Employment is now 11.2% below peak (in log terms).


Comments
Log in or sign up to join the conversation.