
Nonfarm payroll employment continues to rise in June. Here is a graph of some key variables tracked by the NBER’s Business Cycle Dating Committee.
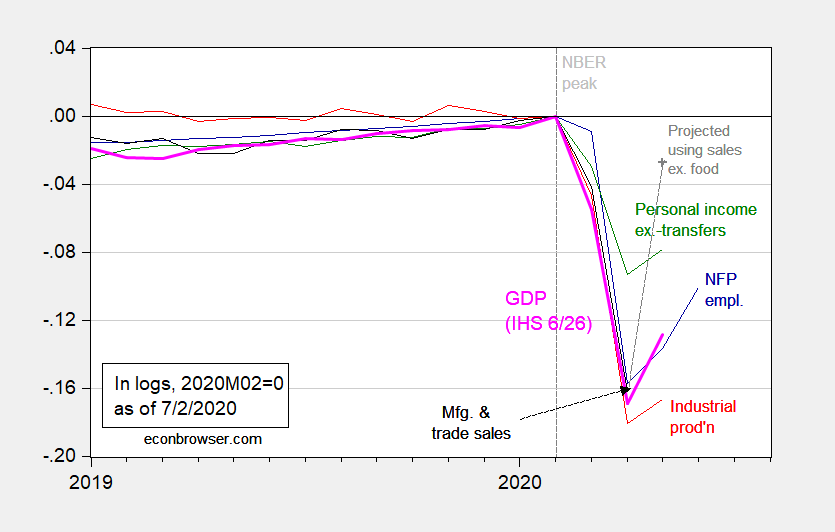
Figure 1: Nonfarm payroll employment (blue), industrial production (red), personal income excluding transfers in Ch.2012$ (green), manufacturing and trade sales in Ch.2012$ (black), and monthly GDP in Ch.2012$ (pink), all log normalized to 2019M02=0. May observation for manufacturing and trade sales projected using log-linear regression of sales on retail sales ex.-food services over the 2019-20M04 period. Source: BLS, Federal Reserve, BEA, via FRED, Macroeconomic Advisers (6/26 release), NBER, and author’s calculations.
I projected manufacturing and trade sales (which only goes through April) using the log-levels relationship between real retail sales ex.-food services and real manufacturing and trade sales, over the 2019M01-2020M04 period (official estimate to be released on 7/16). The R-squared from this regression is about 0.94.
One big caveat to keep in mind: the employment situation surveys were conducted for the pay period encompassing the June 12th. As noted here, toward the end of June, some states began reimposing social distancing restrictions which would’ve impacted employment in retail/food services (and will impact going forward).
As of 7/2, nowcasts incorporating the employment release are: GDPNow is at -35.2% (as is IHS/Markit nee Macroeconomic Advisers), while NY Fed is at -15.2%.


Comments
Log in or sign up to join the conversation.