
Monthly GDP grows 1.5% m/m, pushed by exports. Along with current expectations for this Friday’s employment release, we have the following picture.
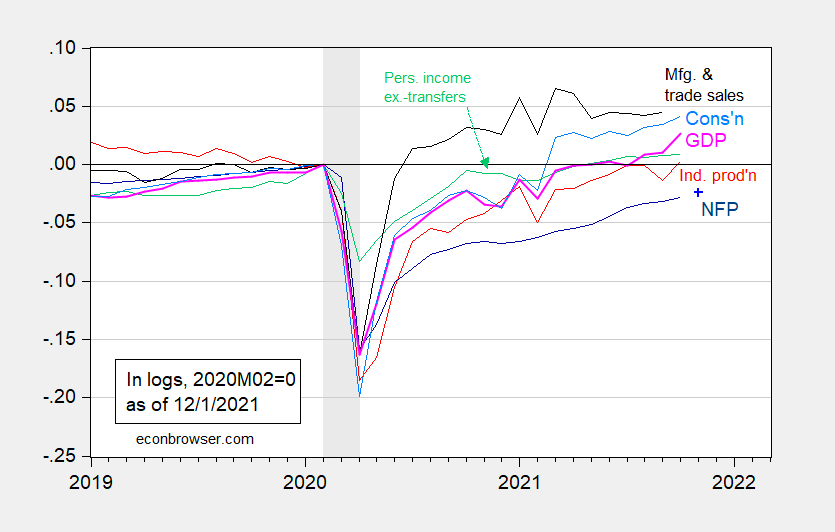
Figure 1: Nonfarm payroll employment (dark blue), Bloomberg consensus for NFP as of 12/1 (blue +), industrial production (red), personal income excluding transfers in Ch.2012$ (green), manufacturing and trade sales in Ch.2012$ (black), consumption in Ch.2012$ (light blue), and monthly GDP in Ch.2012$ (pink), all log normalized to 2020M02=0. NBER defined recession dates, peak-to-trough, shaded gray. Source: BLS, Federal Reserve, BEA, via FRED, IHS Markit (nee Macroeconomic Advisers) (12/1/2021 release), NBER, and author’s calculations.
We now have October observations for five of six indicators tracked. This picture suggests that through October, economic activity was starting to accelerate. However, all these data predates the information regarding the omicron variant (even the Michigan sentiment index discussed in this post).


Comments
Log in or sign up to join the conversation.