


Despite a one-day rebound on Tuesday, most of the past week has seen declines in the S&P 500. Although the drop isn't particularly severe (currently the index is only down to the lowest levels since June 26th), sentiment has taken a sizable hit. The weekly sentiment survey from the American Association of Individual Investors, or AAII, fell sharply from one of the higher readings of the year to the lowest. As shown below, last week the percentage of survey respondents reporting they believed the S&P 500 would move higher in the next six months came in at 44.9%, tying the reading from three weeks prior for the most elevated level of bullishness since the week of April 23rd (46%). One week later, that dropped to 29.6%, which is the weakest investor sentiment reading since the second week of last September.
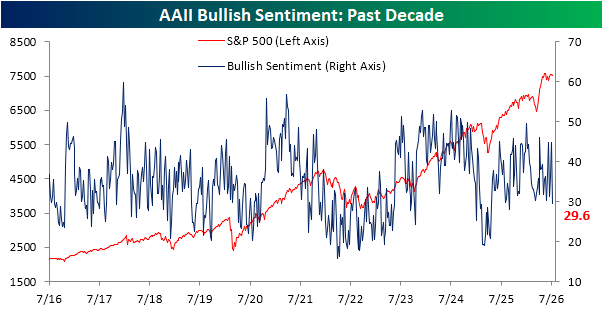
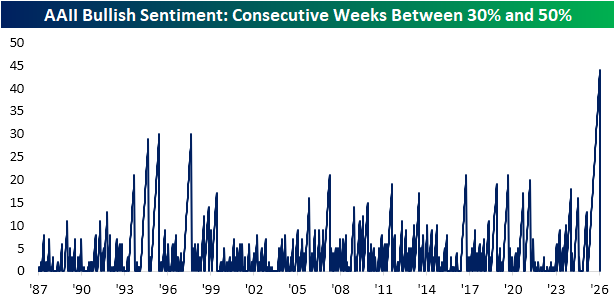
Although there have been some big swings in recent weeks, the actual level of bullish sentiment has been remarkably range-bound recently. For context, since the survey began in 1987, bullish sentiment has been between 30% and 50% about 65% of the time, with an average reading of 37.6% across all weeks. While readings between 30% and 50% are the most common, they have also been consistent over the past year. With this week's fall back below 30%, a historic streak has ended.
As shown below, before this latest sub-30% reading, bullish sentiment came in between 30% and 50% for 44 consecutive weeks. That is by far the longest stretch on record and far surpassed the previous records of 30 straight weeks ending in 1995 and 1998.
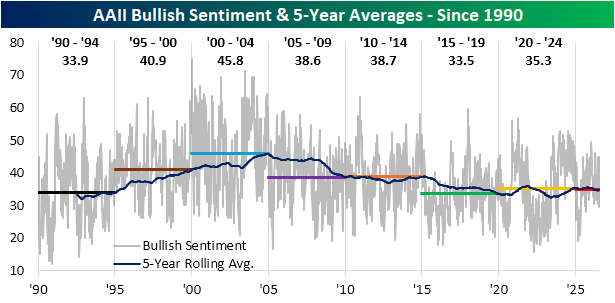
Not only has bullish sentiment sat in a "normal" range for a historic stretch, but elevated bullish sentiment readings have been hard to come by lately. Since the 2020s began, the highest bullish sentiment reading achieved was 56.9% in April 2021. Furthermore, bullish sentiment hasn't registered a reading above 60% since 2010, whereas there were 44 weeks with readings above that level from 1990 through 2010. Conversely, the lowest it has fallen in the 2020s was readings around 15% in April 2022 and a more recent sub-20% reading in early spring 2025. In other words, bullish sentiment has had more downside than upside this decade.
There is some necessary context to this pattern, though. From the start of the survey in 1987 through the mid-2000s, bullish sentiment was generally trending higher on a 5-year rolling basis. However, since around 2005, that has changed to a secular downtrend. Shown a different way, using average readings across five-year periods, sentiment has been little changed over the past decade, and those readings are considerably lower than what was observed in the early 2000s and late1990s.
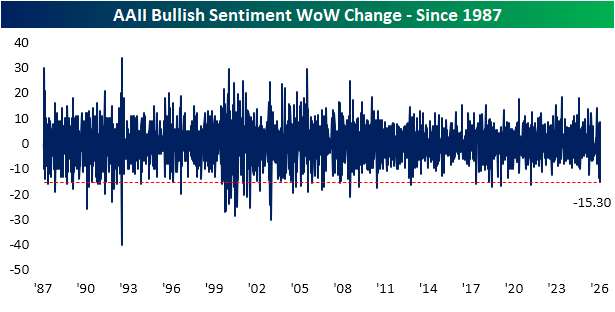
Pivoting back to the most recent week's data, the 15.3 percentage point drop was large. It was the biggest one-week decline in bulls since a 16.5 percentage point decline in September 2021, and that also ranks in the 2nd percentile of all weekly moves since the start of the survey.
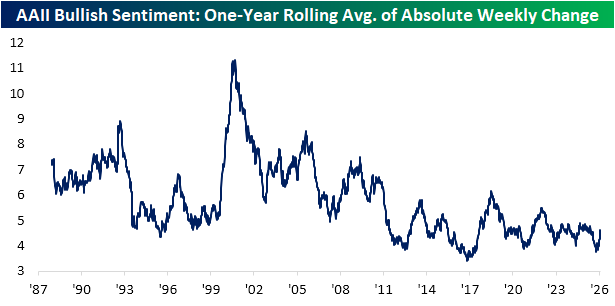
Again, as a testament to the stability of sentiment, below we show the rolling one-year average absolute weekly change in bullishness since the start of the survey. As with the actual level of bullishness, this line has generally trended lower over time, meaning week-to-week fluctuations are less volatile now than they were in years past. With that said, that downtrend has flattened out some in the past decade.
Looking more recently, there was a low of 3.75 percentage points achieved in early April, the lowest reading since November 2017 and a first percentile reading for the full survey history. In the three months since then, the reading has rebounded (meaning sentiment has gotten more volatile), but even at the current level of 4.63 percentage points, it remains in the bottom quartile of readings historically.



Comments
Log in or sign up to join the conversation.