
My previous BTC/USD signal on 30th April was not triggered.
Today’s BTC/USD Signals
Risk 0.50% per trade.
Trades may only be entered before 5pm Tokyo time Tuesday.
Long Trade Ideas
Long entry after a bullish price action reversal on the H1 timeframe following the next touch of $79,440, $77,858, or $77,157.
Put the stop loss $100 below the local swing low.
Adjust the stop loss to break even once the trade is $100 in profit by price.
Remove 50% of the position as profit when the trade is $100 in profit by price and leave the remainder of the position to run.
Short Trade Ideas
Short entry after a bullish price action reversal on the H1 timeframe following the next touch of $80,469 or $81,203
Put the stop loss $100 above the local swing high.
Move the stop loss to break even once the trade is $100 in profit by price.
Remove 50% of the position as profit when the trade is $100 in profit by price and leave the remainder of the position to run.
The best method to identify a classic “price action reversal” is for an hourly candle to close, such as a pin bar, a doji, an outside or even just an engulfing candle with a higher close. You can exploit these levels or zones by watching the price action that occurs at the given levels.
BTC/USD Analysis
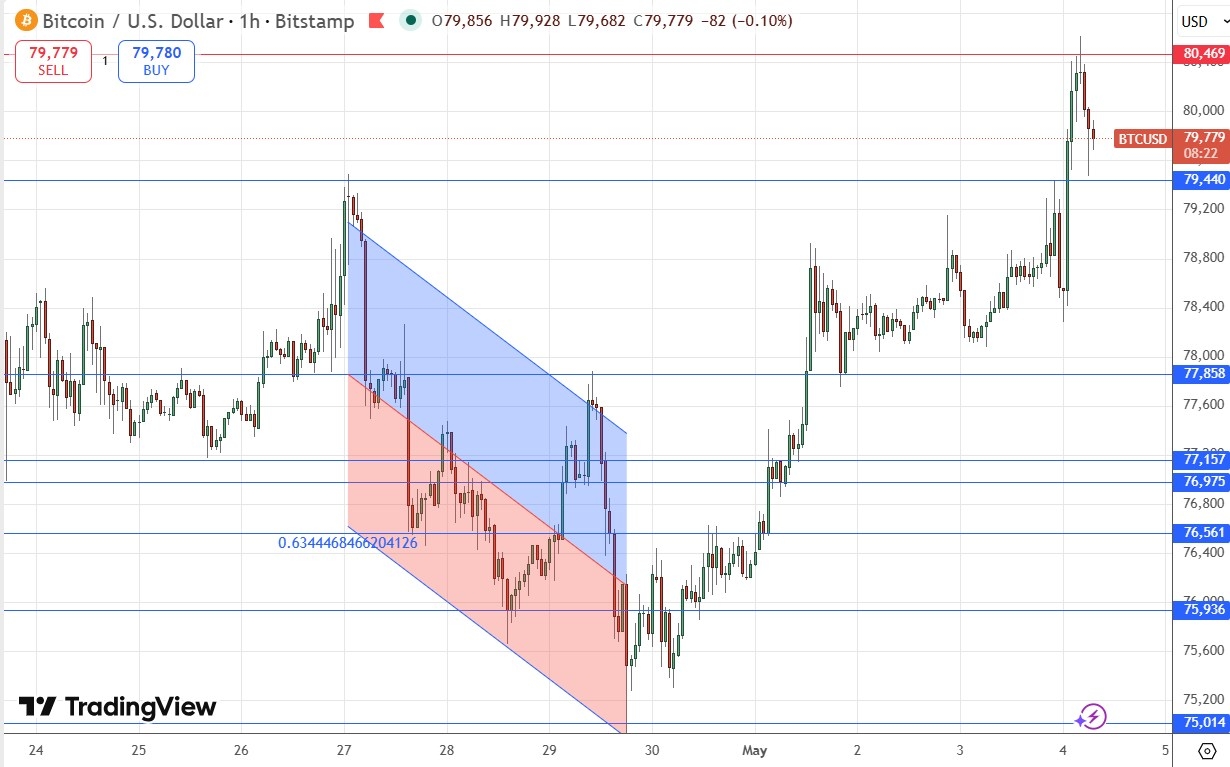
In my last BTC/USD forecast last Thursday, I thought that the key thing to watch out for on the bullish side would be a breakout above the $77,000 area, which was confluent with the upper trend line of the descending linear regression analysis.
I was also looking for a breakout beyond $78,000.
These breakouts did not happen until the next day, but I was correct in my analysis of seeing more potential on the bullish side and seeing these as significant breakouts. After crossing $78,000 the price has continued all the way to a level above $80,000 a few hours ago, reaching a new 3-month high price.
The bullish trend has continued and strengthened, with Bitcoin now moving more in line with US stock markets as a risk-on asset. This suggests that Bitcoin is being viewed more positively by the market and should be interesting to speculators again.
Bulls do have an issue – the price just printed new key resistance at $80,469 that had a bearish impact when reached. This level looks likely to be pivotal today.
A buy on a dip to $77,858 and a bounce there could be a nice trade if it sets up.
A bullish breakout above the new resistance level at $80,469 will probably be an even better signal to enter a long trade, if the breakout is convincing. I like to see two consecutive hourly candlesticks closing higher above that level, with little upper wick on the second candlestick.
https://www.tradingview.com/chart?symbol=COINBASE%3ABTCUSD
There is nothing of high importance due today regarding either Bitcoin or the US Dollar.
Comments
Log in or sign up to join the conversation.