


The Pound Sterling (GBP) holds firm against the US Dollar (USD) during the North American session on Thursday, after US jobs data reinforces the thesis that the labor market remains solid ahead of Friday’s Nonfarm Payrolls report. The GBP/USD pair trades at 1.3466, after bouncing off daily lows of 1.3404.
GBP/USD holds near 1.3460 as jobless claims hit two-year lows
The US Department of Labor reported that Initial Jobless Claims for the week ending August 1 came in at 199K, exceeding the prior week’s print but below estimates of 202K. Earlier, the Challenger job cuts showed that planned layoffs tumbled 27% to 33.429K in July, its lowest level since July 2024.
Therefore, US economic data releases during the day suggest that the Federal Reserve (Fed) could remain laser-focused on tackling high inflation, which has so far remained five years above the 2% goal.
Eyes shift to Nonfarm Payrolls, which are expected to come at 80K, above June’s 57K print. Alongside this, the Unemployment Rate is projected to remain steady at 4.2%, below the Fed’s 4.5% target towards the end of 2026.
Meanwhile, geopolitics is expected to continue to drive the markets, as a possible deal between Iran and Oman could reopen the Strait of Hormuz. Nevertheless, an Iranian Journalist reported that the intermediary contact between the US and Iran is false and that Iran-Omani negotiations set the rules for sailing through the Strait of Hormuz.
Recently, the details of the Iran-Oman deal had leaked, and according to the draft, vessels belonging to the US, Israel and hostile countries, through Hormuz, will be prohibited.
In the UK, the S&P Global Construction PMI rose to 44.7 last month from June’s 38.4, showing an improvement despite the ongoing slowdown in the sector, as builders turned more optimistic since the pre-Middle East war.
GBP/USD Price Forecast: Technical outlook
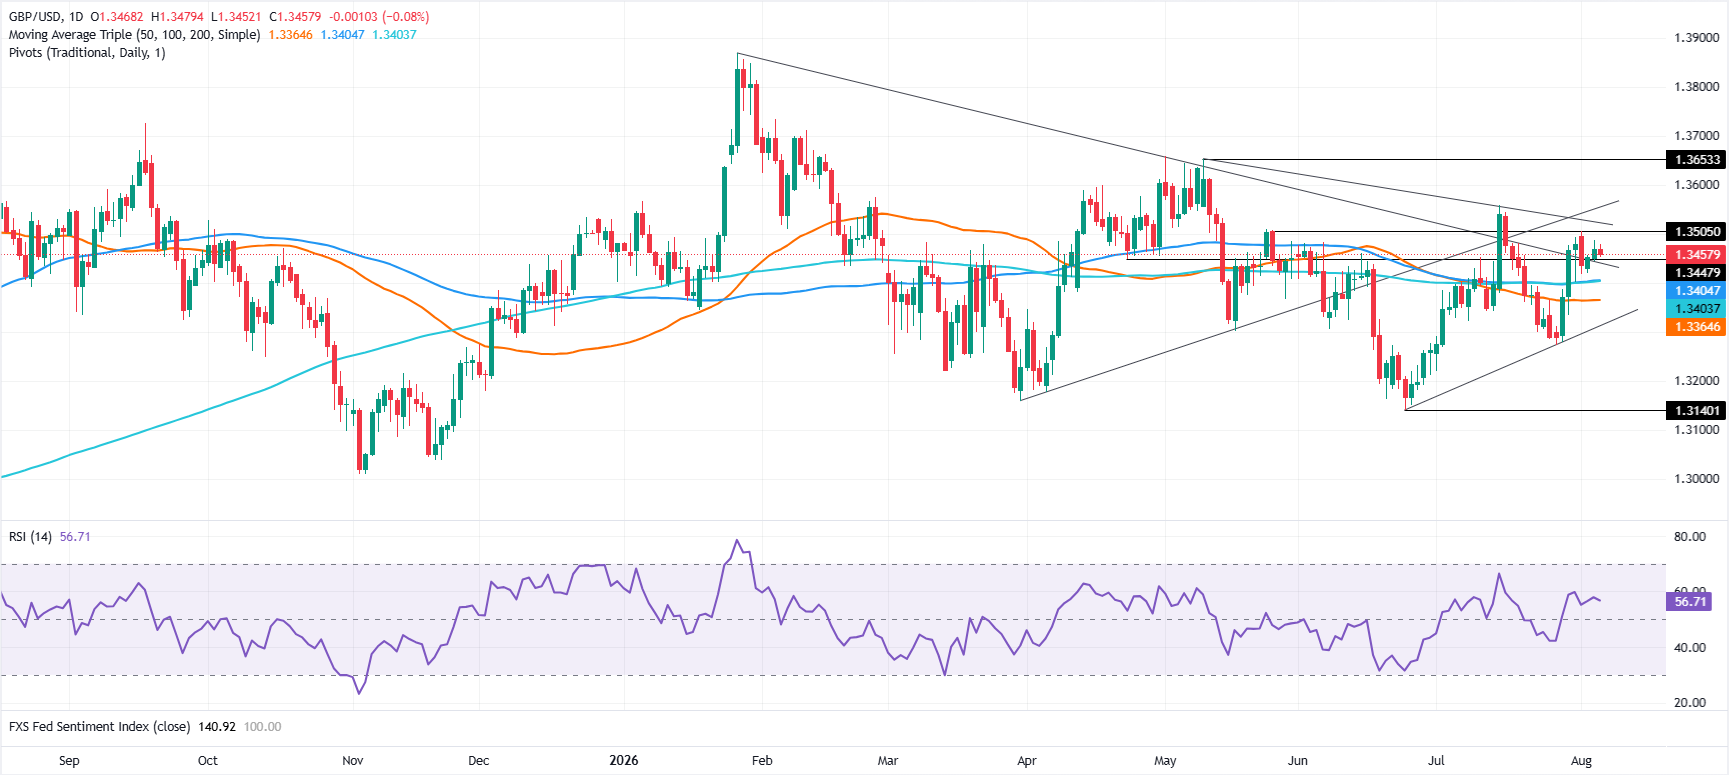
GBP/USD daily chart
In the daily chart, GBP/USD trades at 1.3458, maintaining a mildly bullish near-term bias as spot holds above the reclaimed descending trend line around 1.3441 and the clustered 50/100/200-day simple moving averages (SMA) near 1.3365. Price also sits comfortably over the higher rising trend support drawn from 1.3140 around 1.3316, while the Relative Strength Index (RSI) at 56.7 stays above the neutral 50 line, hinting that upside momentum is still constructive though not overstretched.
On the topside, initial resistance emerges at the descending trend line from 1.3653, now intersecting near 1.3523, ahead of the higher upward-sloping trend barrier around 1.3554, where buying pressure could start to fade. On the downside, immediate support is seen at the prior resistance trend line turned floor around 1.3441, followed by the multi-period SMA cluster near 1.3365 and then the lower rising trend support around 1.3316, where bulls would be expected to defend the broader constructive structure.


Comments
Log in or sign up to join the conversation.