

Silver price extends its losses, following Gold’s path, as the latest Fed Minutes showed that officials expect another rate increase towards the year-end. The XAG/USD trades at $59.69, down by over 1.67%.
XAG/USD Price Forecast: Technical Outlook
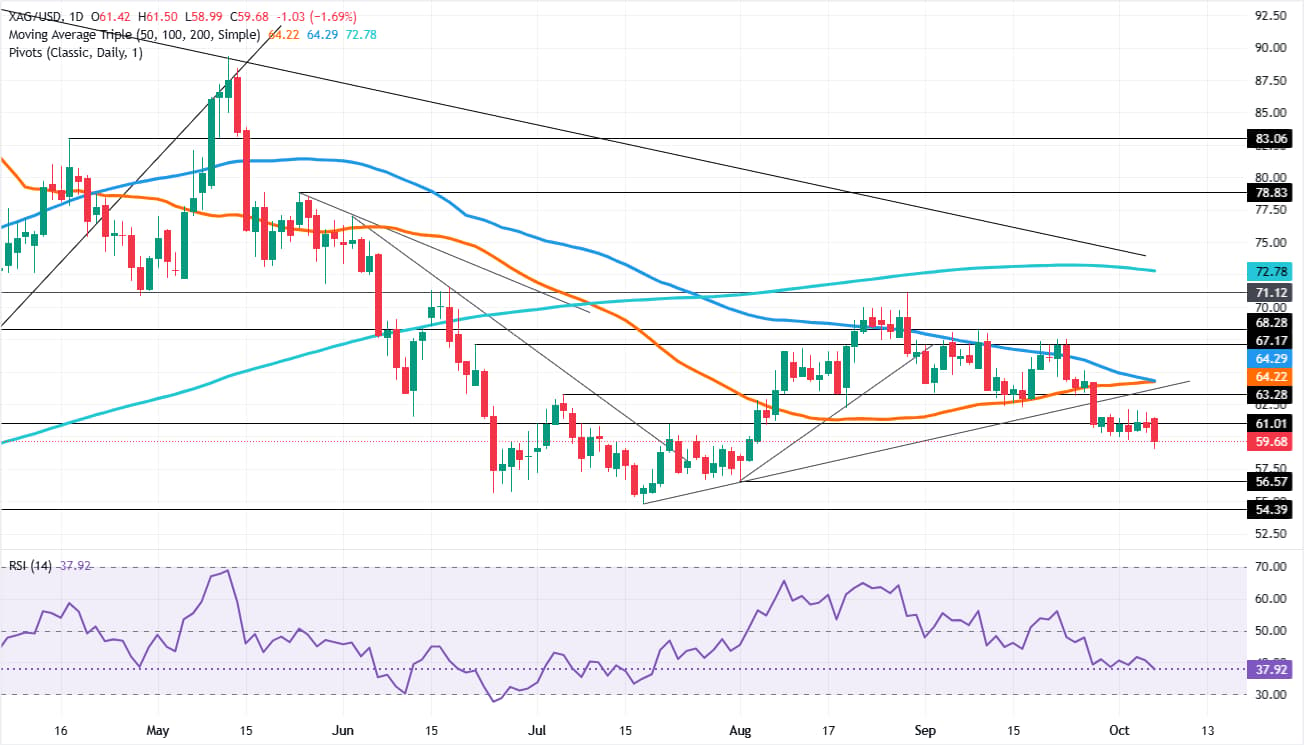
Price action shows the white metal is neutral to downward-biased, as it remains below the 50-, 100-, and 200-day Simple Moving Averages (SMAs), each at $64.22, $64.28, and $72.78. Also, the market structure of lower highs and lower lows remains intact, while bearish momentum accelerates, as indicated by the Relative Strength Index (RSI), which is aiming towards oversold territory.
Hence, the path of least resistance suggests further downside. For a bearish continuation, XAG/USD must clear $59.00. Below, the next stop is August 3, low of $56.57, followed by the year-to-date (YTD) low of $54.77. Once those levels are taken out, Silver could reach $50.00.
On the other hand, for a bullish reversal, the first resistance for XAG/USD is the October 2 daily and monthly peak of $62.09. Once surpassed, the next stop is the confluence of the 50- and 100-day SMAs at $64.22-$64.28. Above is $65.00 ahead of the $70.00 psychological level.
XAG/USD Price Chart – Daily

Comments
Log in or sign up to join the conversation.