


The Pound Sterling holds firm during the North American session as UK inflation data dipped, easing pressure on the Bank of England to tackle higher prices, while attacks between the US and Iran don’t seem to be ending in the Middle East. The GBP/USD trades at 1.3377.
GBP/USD holds as softer inflation offsets Middle East risks
During the European session, UK inflation data for June dipped from 2.8% to 2.6% YoY. The core Consumer Price Index (CPI) remained steady at 2.6% YoY for the same period. Even though this relieves the BoE, traders continued to price in an 82% chance for a rate hike by the November 5 meeting, according to Prime Terminal data.
The data was a relief to the new Prime Minister, Andy Burnham, who is seeking to implement measures to reduce the high living costs.
The new UK Finance Minister, John Healey, said the data was positive but that the government would need to do more to help households.
Despite this, the Gulf War triggered a jump in Oil prices, with West Texas Intermediate (WTI), the US crude benchmark, rising by over 2.5% to $86.70. So far in July, petrol prices have risen nearly 24%, shy of recovering the $90 figure, WTI’s floor level in June.
Recently, the US President Donald Trump warned Iran that if they attack ships, the US would retaliate, attacking bridges or power plants, including those located near Tehran.
In the US, the economic docket is absent, yet traders are waiting for the release of Initial Jobless Claims for the week ending July 18. Alongside this, traders are also bracing for S&P Flash PMIs and the Federal Reserve’s (Fed) monetary policy decision next week.
Money markets have priced in a 65% chance that the Fed would keep rates unchanged at the July 29 meeting, down from 78% a day earlier, according to Prime Terminal data.
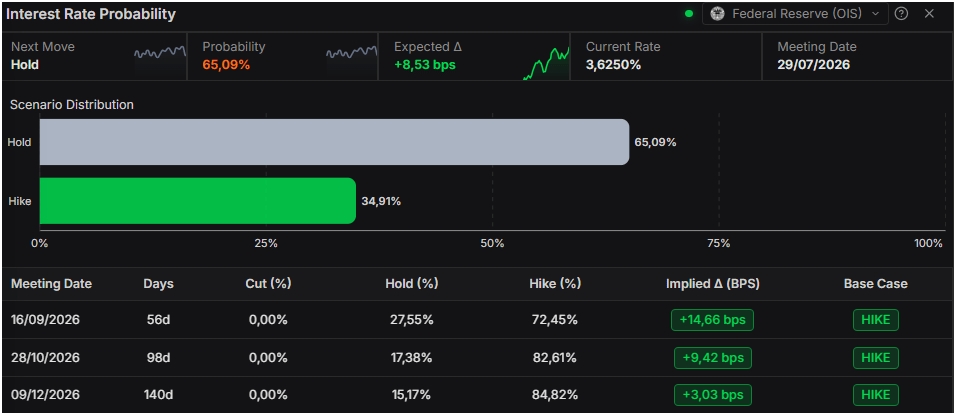
Source: Prime Terminal
GBP/USD price forecast: Technical outlook
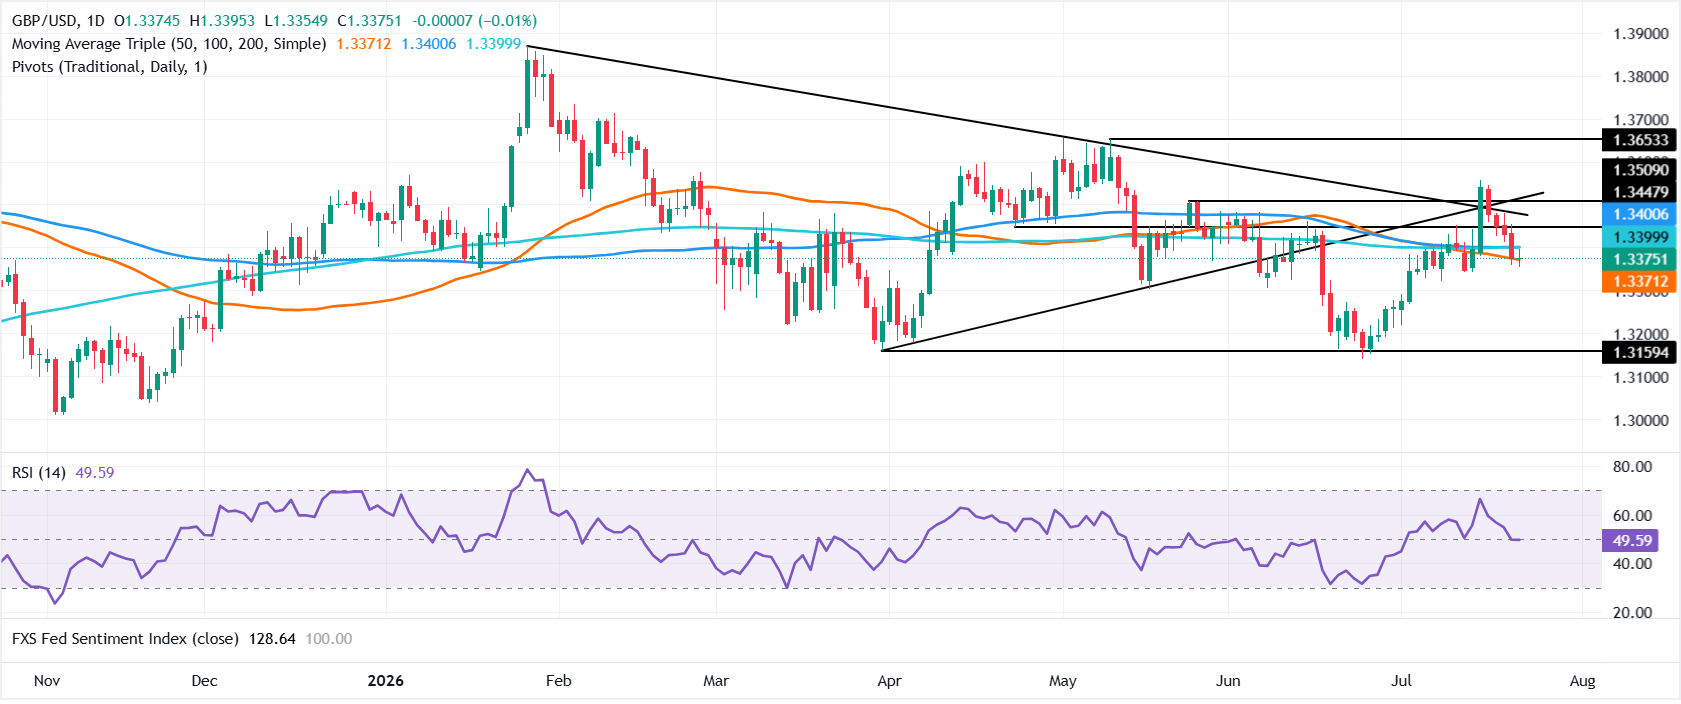
GBP/USD daily chart
In the daily chart, GBP/USD trades at 1.3375, maintaining a mildly bearish near-term bias as spot continues to hold beneath the cluster of Simple Moving Averages (50, 100 and 200-day SMAs) between roughly 1.3464 and 1.3472, as well as the descending resistance trend line at 1.3476. The Relative Strength Index (RSI 14) at 50 reads neutral, hinting at a consolidative tone rather than strong directional momentum. The latest FXS Fed Sentiment Index reading at 128.64 suggests a relatively firm policy backdrop that may continue to cap Sterling on rallies.
On the topside, initial resistance is located at the 50-day SMA at 1.3464, followed by the 100-day SMA at 1.3468 and the 200-day SMA at 1.3472, all reinforcing a dense supply zone near the recent trendline barrier at 1.3476. A sustained break above this band would be needed to ease bearish pressure. With no clear technical support levels immediately below the market in the current dataset, any pullback from present levels would likely retest recent lows, leaving the pair vulnerable to further downside while it trades under the aforementioned moving average cluster and trend resistance.



Comments
Log in or sign up to join the conversation.