


The GBP/USD pair declines to near 1.3500 during the early European trading hours on Wednesday. Ongoing tensions in the Middle East provide some support to a safe-haven currency such as the US Dollar (USD) against the British Pound (GBP). All eyes will be on the US August jobs report later on Friday.
CNBC reported that the US and Iran traded a new round of attacks Tuesday, with American forces striking Iranian targets around the critical waterway and Tehran saying it had launched a retaliatory operation targeting US interests across the region.
US President Donald Trump said the strikes were in retaliation for Iran trying to put mines in the critical waterway and for an earlier attack on a military base. He warned of more attacks to come if Tehran responded.
Bank of England (BoE) Governor Andrew Bailey downplayed the inflation threat, saying that the United Kingdom (UK) is not yet experiencing significant second-round inflation effects. Markets are fully pricing in a 25 basis points (bps) hike this year and another by the spring, according to Bloomberg.
“We’re seeing quite subdued second-round effects; I think we’ve seen a softening labor market for some time now,” said Bailey. “I’ve taken the view that I think we can watch this situation for the moment,” he added.
GBP downside risks persist as UOB keeps focus on 1.3480
Strategists at UOB Group maintain a cautious stance on GBP, reiterating that while they had previously highlighted last Friday (28 Aug, spot at 1.3595) that GBP “could edge lower,” they initially expected “any decline could be contained within a 1.3550/1.3645 range.” However, after the Pound slipped to a low of 1.3527, they noted yesterday (31 Aug, spot at 1.3540) that “the risk remains on the downside, and the level to watch is 1.3480.” UOB adds that they “will continue to hold the same view as long as GBP holds below 1.3600,” keeping 1.3600 unchanged as the “strong resistance” level.
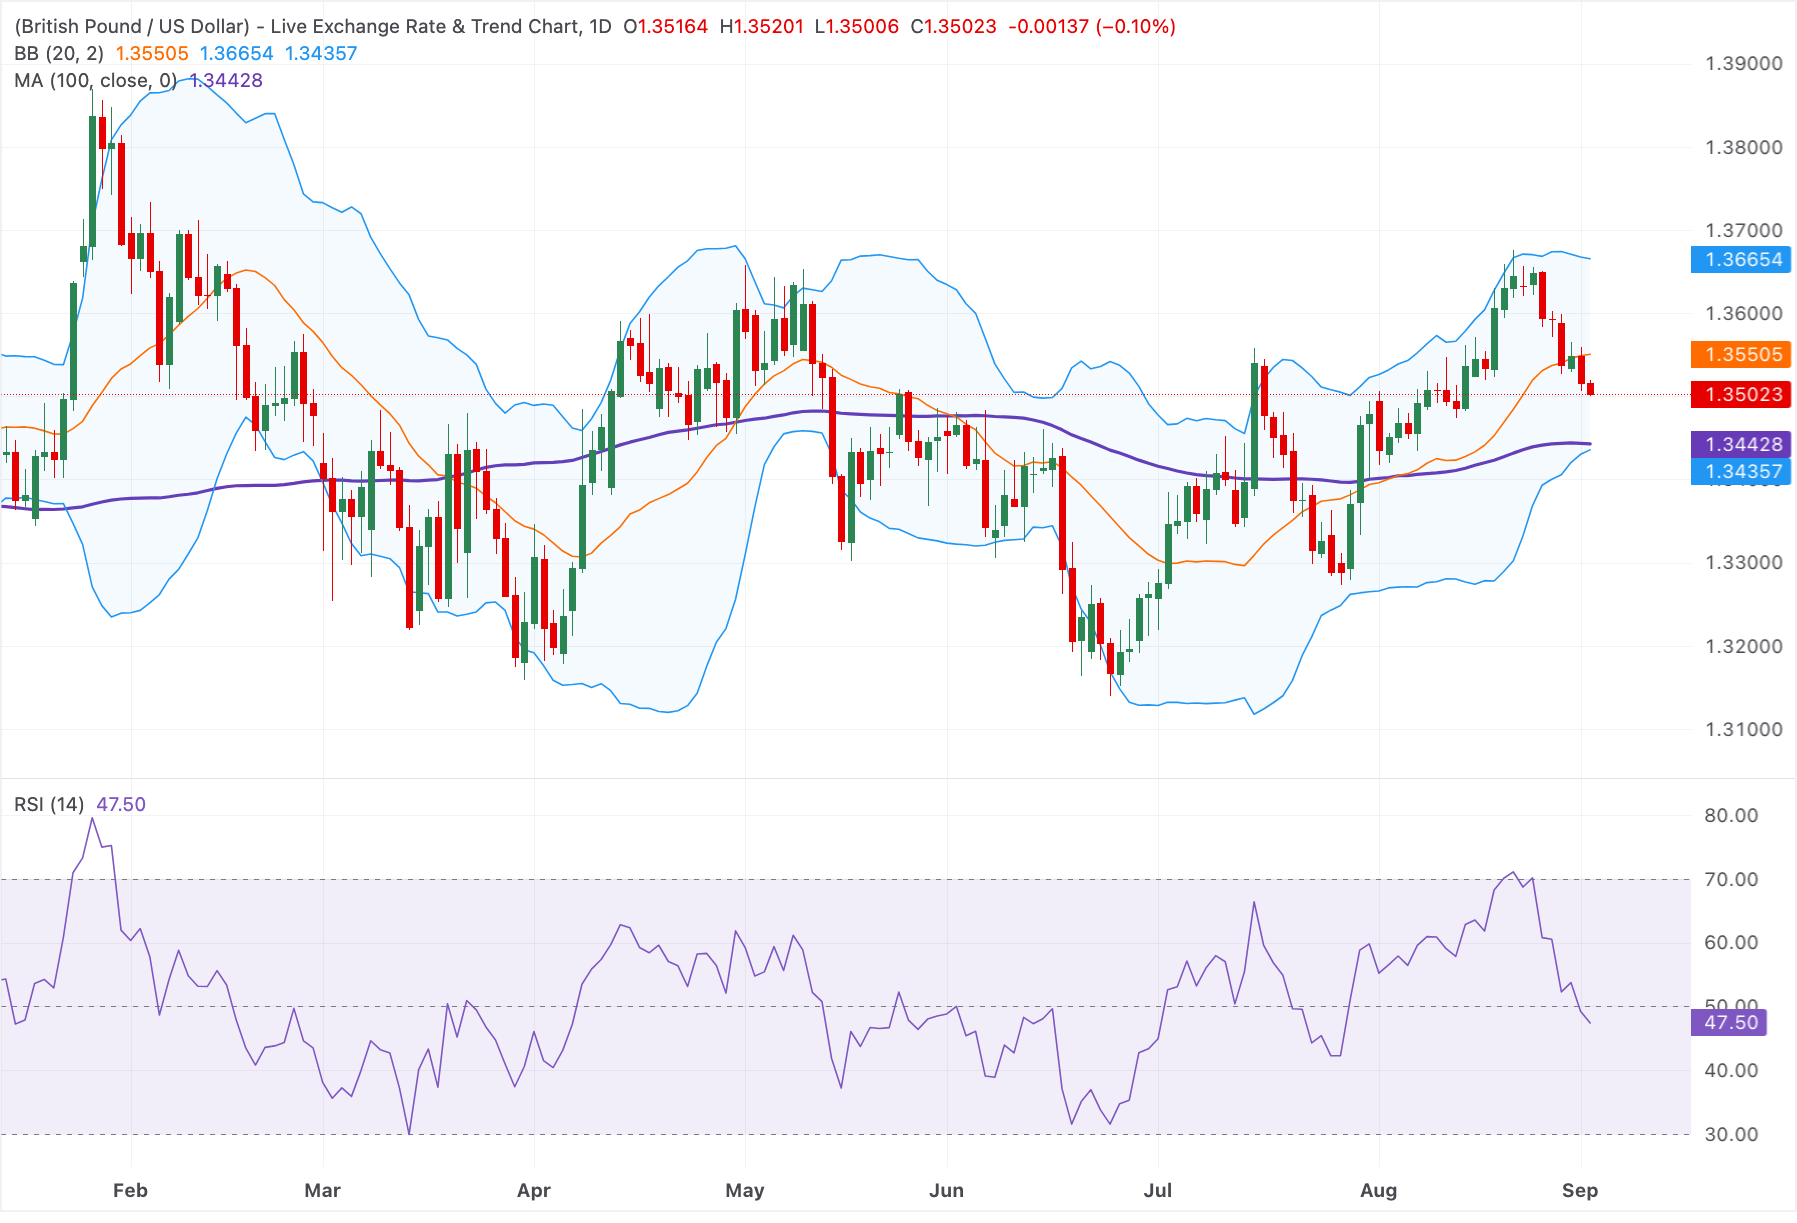
Technical Analysis: GBP/USD keeps a bullish vibe above the 100-day SMA
In the daily chart, GBP/USD holds a modest bullish bias as spot remains above the 100-day simple moving average (SMA) and the lower Bollinger Band, suggesting underlying demand on dips. However, price is still trading below the Bollinger mid-line, indicating that upside traction is not yet dominant, while the Relative Strength Index (RSI) at about 47 keeps momentum in a neutral-to-slightly consolidative stance.
On the topside, initial resistance emerges at the Bollinger middle band around 1.3550, where a daily close above would open the door toward the upper Bollinger Band near 1.3665. On the downside, immediate support is defined by the recent price area around 1.3500, with the 100-day SMA at 1.3443 and the lower Bollinger Band at 1.3435 forming a nearby demand cluster that, if broken, would undermine the current constructive bias.



Comments
Log in or sign up to join the conversation.