

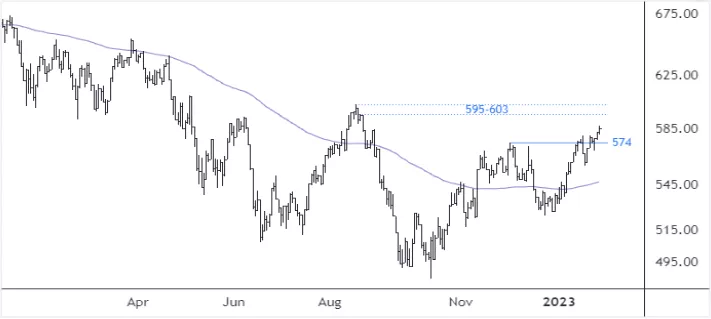
Below is a daily chart of the Value Line Geometric Composite Index (aka VLG) which, in my opinion, is the best measure of the broad US stock market. It has about 1.700 company stocks from all major sectors/industry groups and of all types and sizes, all having equal weight, and the index is computed with a geometric average.
In mid-January, I pointed out that if VLG pushed convincingly through and stayed above the 574 level, then higher levels were likely to been seen. As can be seen in the chart, that is what has happened. I expect a further rise at least to my next potential targets in the area of 595-603, given the index does not decline below 574. If such an advance takes place, then it likely turns the long-term trend to the upside.
More By This Author:
Stock Price Of Marel At Critical Point
Bank Index Finally Wakening
Value Line Geometric Index At Important Inflection Point
Comments
Log in or sign up to join the conversation.