
The delayed BLS employment report came in well above expectations, showing the economy added 130k jobs in January. Furthermore, the unemployment rate slipped to 4.3% versus expectations of a 0.1% increase to 4.5%. The more encompassing U6 unemployment rate fell from 8.4% to 8.0%. The BLS labor report contradicts the monthly and weekly ADP reports, showing job growth closer to 25k a month. Since the pandemic, the BLS report and the ADP labor market reports have not been nearly as correlated as they were. While we hope the BLS report is correct and the labor market is improving, we are concerned that revisions to the BLS have been higher than normal, and January has many seasonal adjustments that can skew data. That said, if the BLS report accurately reflects a pickup in the labor market, the reflation narrative may have some legs.
There is one concerning data point in the BLS report worth noting. As we share below, courtesy of Ernie Tedeschi, the median duration of unemployment, as measured in weeks, has been rising and now sits at 11 weeks. Going back over 50 years, this is a relatively high value, suggesting the labor market is not as strong as the January BLS labor report indicates. Furthermore, our Tweet of the Day shows that Revelio’s private labor gauge indicates negative job growth.

What To Watch Today
Earnings
(Click on image to enlarge)

Economy
(Click on image to enlarge)

Market Trading Update
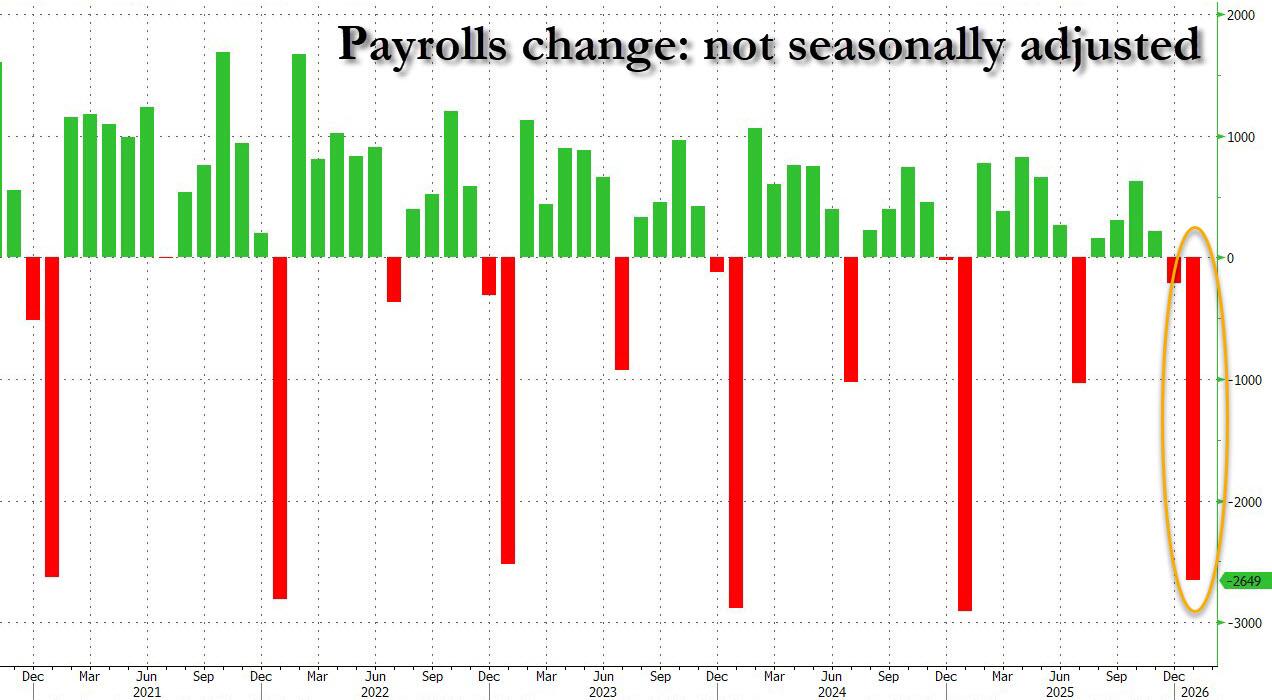
Yesterday, we discussed the recent narrative that Bitcoin could go to zero. With respect to the market, the much stronger, headline at least, employment report led to a sell-off in the technology names, as concerns that the Federal Reserve would potentially be pushed to hold rates a higher levels for longer. However, digging into the employment report, the headline was only stronger due to a massive “seasonal adjustment” that will likely be revised away in subsequent months.
“There is another reason why today’s report will be revised away: while the seasonally adjusted change was a stronger than expected 130K, the unadjusted was a negative 2.649 million. That means that the entire delta in today’s “surprise beat” was due to seasonal adjustments.” – Zerohedge
However, while employment is likely much weaker than expected, the number led to a jump in yields and a reduction in rate cut expectations. Both impacted stocks as the market adjusted discount rates for future earnings. Part of the weakness in US markets has also been the decline in the dollar. As we noted previously, there is a very large short position against the dollar, and there has been a shift in “flows” into non-US equities due to the impact of a weaker dollar on foreign investors. However, as shown, the flows into the global assets, ex-Technology, is now at the highest levels on record. The last time we saw a similar flow was in 2021.

Secondly, flows into international markets (ex-US) have also been very strong over the last 49 months, which is a very long stretch outside a secular bear market.

As shown, over the last 15 years, there has been an inverse correlation between emerging markets, for example, and the US Dollar.
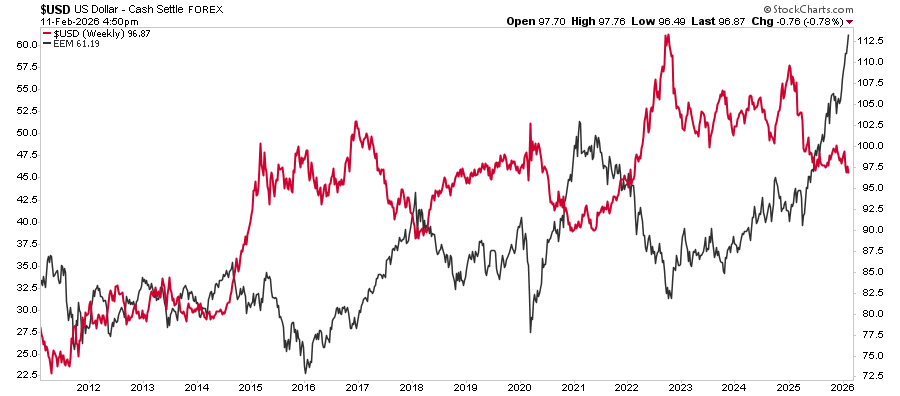
However, such periods of outperformance eventually resolve as the dollar strengthens. There are currently many reasons to expect the dollar to rally in the future, but, from a purely technical viewpoint, the dollar’s deep oversold condition, along with very negative sentiment, has historically been a strong backdrop for a dollar rally.

As shown, previous monthly oversold conditions (3-year measure) lead to fairly strong dollar rallies. With a large short position on the dollar currently, if the economic data strengthens further, as expected, the reversal of flows into US dollars could be fairly swift. While timing is always risky, it is good practice to rebalance regularly to mitigate the risk of more negative outcomes.
New Home Prices Vs. Resale Prices
The most recent data from John Burns Research shows that the price premium new homes typically command over re-sales no longer exists. Over the last ten years, as shown below, new home prices have been anywhere from 10-40% above resale prices. In October 2025, the median new single-family home sold for $392,300, down 3.3% from September, while the median existing-home price in December was $405,400. Builders are much more aggressive in selling new homes than homeowners. They are offering incentives like rate buydowns and price cuts to move inventory amid high mortgage rates and large inventories. Moreover, they have shifted to building smaller, lower-priced homes. It’s worth adding that apartment rents also eased to a four-year low of $1,353 in January 2026, thanks in part to surging multifamily supply. This makes renting more advantageous than buying and reduces demand for new and existing homes.

The Value Rotation Illusion
“Value is back in vogue”, the media claim. Investors are rushing out of the high-flying mega-cap tech stocks and into the boring staples, utilities, and healthcare stocks. Given the huge outperformance of value stocks versus growth stocks, it appears investors are going all in on the value rotation. What some of these investors don’t know is that they are not necessarily buying value but could, in fact, be selling it.
Before turning your investment perspective upside down, let’s define how most investors think about value and growth stocks. Commonly, investors refer to value stocks as those whose shares trade at a low price relative to their earnings and earnings potential. Growth stocks are those whose earnings are expected to grow faster than the market average.
For some reason, investors often assume that growth and value are mutually exclusive. They are not, as we will explain.

Tweet of the Day

More By This Author:
Bond Yields May Plummet: Five Potential CatalystsSanae Takaichi And The Yen Carry Trade
Speculative Narrative Unwinds

Comments
Log in or sign up to join the conversation.