


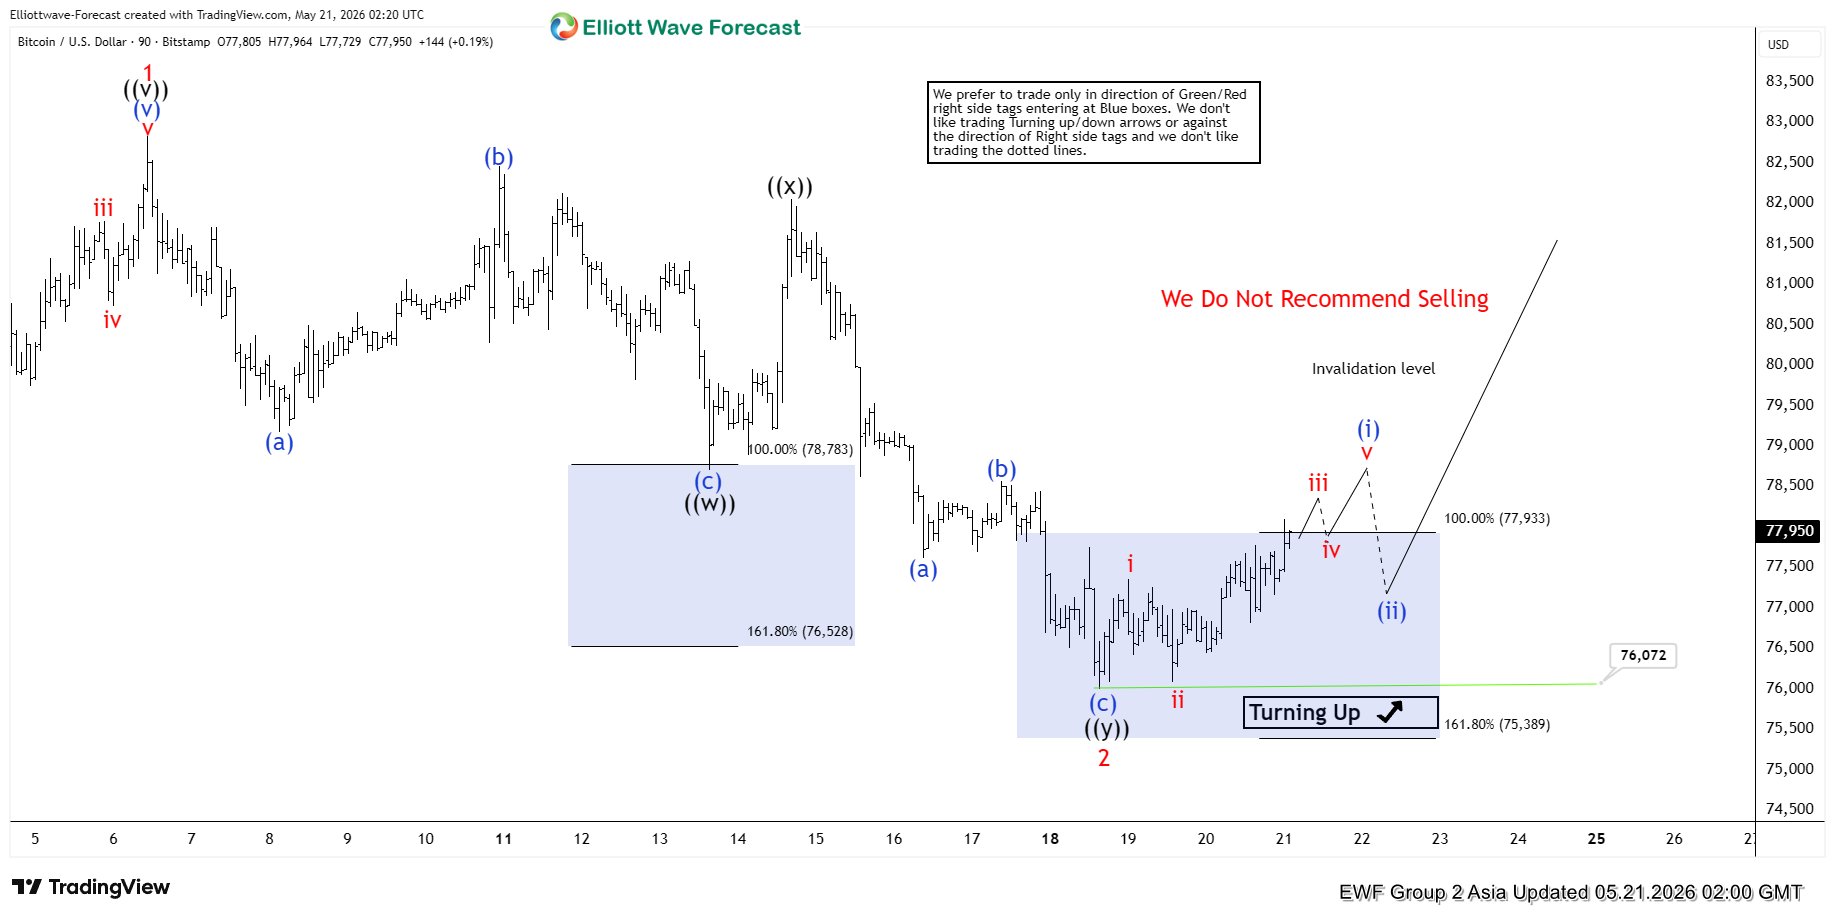
The short‑term Elliott Wave outlook for Bitcoin (BTC.X) (BTCUSD) shows the rally from the March 29 low concluded as wave 1 at $82,833. After this peak, the market corrected in wave 2, unfolding as a double three Elliott Wave structure. From the wave 1 high, wave (a) ended at $79,168. The rally in wave (b) reached $82,458. Wave (c) then dropped to $78,704, completing wave ((w)) at a higher degree. Bitcoin rebounded in wave ((x)), which finished at $82,047, setting up the next decline.
The cryptocurrency extended lower in wave ((y)), which subdivided into a zigzag structure. From the wave ((x)) high, wave (a) ended at $77,614. A modest rally in wave (b) concluded at $78,573. The final leg, wave (c), dropped to $76,072, completing wave ((y)) of wave 2 at a higher degree. This decline brought Bitcoin into the blue box support zone, defined by the 100% to 161.8% Fibonacci extension of wave ((w)). Buyers responded at this level, producing a turn higher. Near term, as long as the pivot at $76,072 remains intact, Bitcoin is expected to extend its rally.
Bitcoin (BTCUSD) 90-Minute Elliott Wave Chart



Comments
Log in or sign up to join the conversation.