


Image Source: Unsplash
Bitcoin with ticker BTCUSD has been slowing down since January, but notice that it's still holding up well above the important weekly trendline and 50-week moving average, so it still shows a bullish technical picture, especially if we consider a corrective movement in the lower timeframe chart.
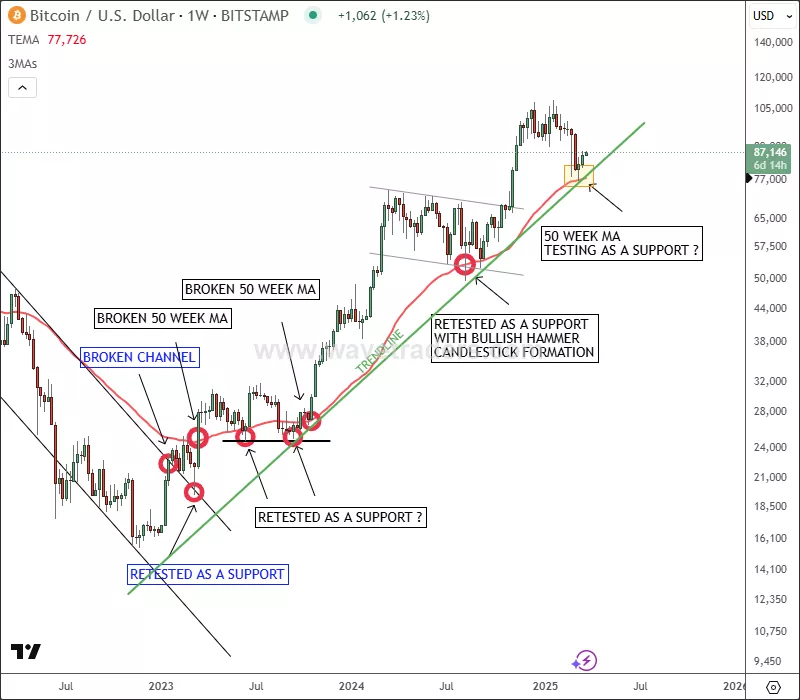
BTCUSD Weekly Technical Chart
In the 4-hour chart of BTCUSD we can see it trading lower, but notice that wave structure is overlapped, which indicates for a corrective movement, so it's ideally still finishing a complex W-X-Y correction in wave 4, where final subwave C of (Y) is now in play and it can be coming to an end at 76k-72k support zone. We can actually see an interesting bounce and recovery within a potential leading diagonal formation that can be a signal for a reversal up, however, to confirm support in place and bullish continuation for wave 5, we have to see sharp or impulsive recovery back above channel resistance line near 90k area.
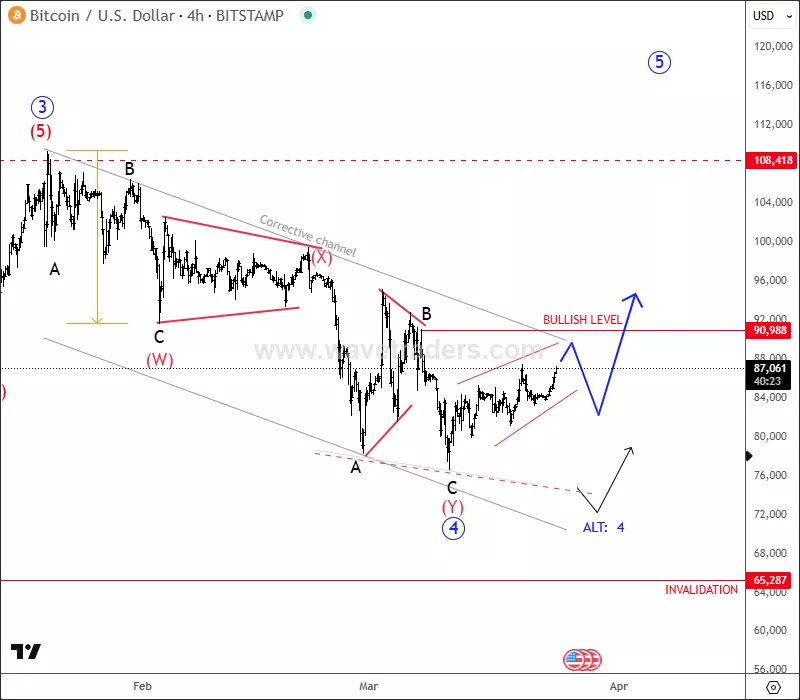
BTCUSD 4H Elliott Wave Chart
More By This Author:
AUD/NZD Finally Turning Bearish?
Elliott Wave Market Update: Dollar Weakness Can Resume After Fed Rate Decisions This Week
Coffee Remains Bullish As Expected



Comments
Log in or sign up to join the conversation.