


Bitcoin closed the week below its 50-week moving average for the first time in two months, just as warnings grow that the calm in the oil market may not last.
The weekly candle closed at $74,851 at midnight UTC on Sunday. That is below the 50-week simple moving average (MA), the average of the last 50 weekly closes, which sits at $75,535. It was also the fifth losing week in a row, and BTC trades at $74,312 on Binance on Monday morning.
Oil has gone the other way. Brent crude, the global oil benchmark, fell 17% from $117.64 on October 30 to $97.35 this morning, as traders bet on a deal to end the war with Iran.
That bet may be early. Amos Hochstein was an energy adviser to President Joe Biden. He told CNBC that the risk of renewed war is “still alive.” If fighting resumes, he said, gasoline, diesel, and jet fuel prices would all surge.
So if oil spikes again, does BTC fall further?
Oil Prices Fell 17%, but the War Risk Has Not Gone
The drop came fast. Brent lost 10.9% on Monday, November 2, and another 8.7% on Wednesday, as traders bet that the fighting would end.
No deal has been signed. Late Saturday, U.S. Central Command said it had disabled a tanker that ignored warnings after visiting an Iranian port, and attacks on tankers near Oman have continued since the U.S. election.
Others see the same risk. Rapidan Energy, an energy consulting firm, puts the chance that fighting resumes at 80%. Its president, Bob McNally, expects crude to climb back above $100 a barrel if it does.
Oil Jumps Have Usually Meant Red Days for BTC
The pattern since the spring is clear enough to watch. We matched every Brent trading day since March 2 with BTC’s move on the same date, 176 days in all.
Brent up 3% or more: 45 days. BTC fell on 30 of them, by 0.91% on average.
Brent moved less than 3%: 104 days. BTC rose 0.37% on average.
Brent down 3% or more: 27 days. BTC rose on 16 of them, by 0.71% on average.
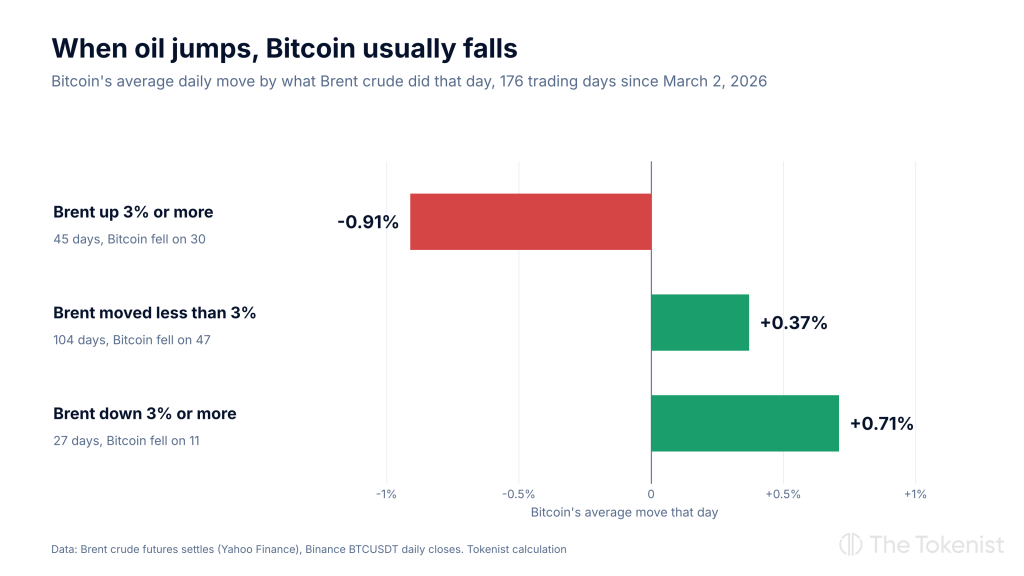
Last week showed both sides. On Wednesday, Brent fell 8.7%, and BTC rose 3.9%. On Thursday, Brent rose 3.9%, while BTC fell 5.5%.
The link is loose, not fixed. Both prices react to the same war headlines, and on a third of the big oil-up days, BTC still rose. The timing is also approximate, because Brent settles in New York while Binance’s daily candle closes at midnight UTC.
Still, a renewed oil spike would hit BTC at a weak moment, with the price already below its long-term average.
Bitcoin Price Analysis: Can BTC Win Back $75,535?
Not yet. BTC trades at $74,312, about 1.6% below the 50-week MA at $75,535, and a weekly close back above it next Sunday would undo the break.
On the daily chart, BTC is also below both of its exponential moving averages (EMAs), averages that weight recent prices more. They sit at $76,492 for 200 days and $79,279 for 50 days.
Resistance: $75,535, the 50-week MA, then $76,492, the 200-day EMA. Above that, $79,279, the 50-day EMA.
Support: $73,510, Sunday’s low. Below that, $73,027, the August 21 low.
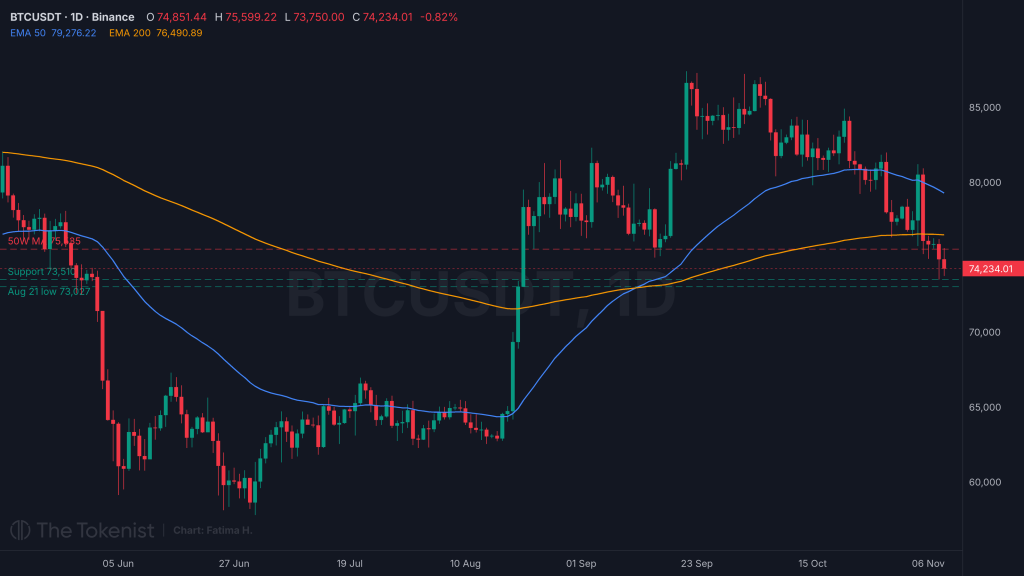
BTCUSDT 1D chart. Source: TradingView.
Scenario | Condition | Where it could lead |
|---|---|---|
Advance | A weekly close back above $75,535 | $76,492, the 200-day EMA, then $79,279 |
Pause | BTC holds between $73,510 and $75,535 | A range under the 50-week MA |
Retreat | A daily close below $73,510 | $73,027, the August 21 low |
For Bitcoin, the oil market is now a risk worth watching. If talks with Iran collapse and Brent jumps, the pattern since March points to more pressure on BTC.



Comments
Log in or sign up to join the conversation.