

In this technical blog, we are going to take a look at the past performance of 1 hour Elliott Wave Charts of Bitcoin ticker symbol: $BTCUSD, which we presented to members at elliottwave-forecast.com. In which the rally from December 18.2019 low ( $6424.16) unfolded in 5 waves impulse structure. Thus suggested that it’s a continuation pattern and as per Elliott wave theory after 3 waves pullback it should do another extension higher in 5 waves impulse structure at least. Therefore, we advised members not to sell the instrument & trade the no enemy areas ( blue boxes) as per Elliott wave hedging remained the preferred path looking for 3 wave reaction higher at least. We will explain the structure & forecast below:
Bitcoin 1 Hour Elliott Wave Chart
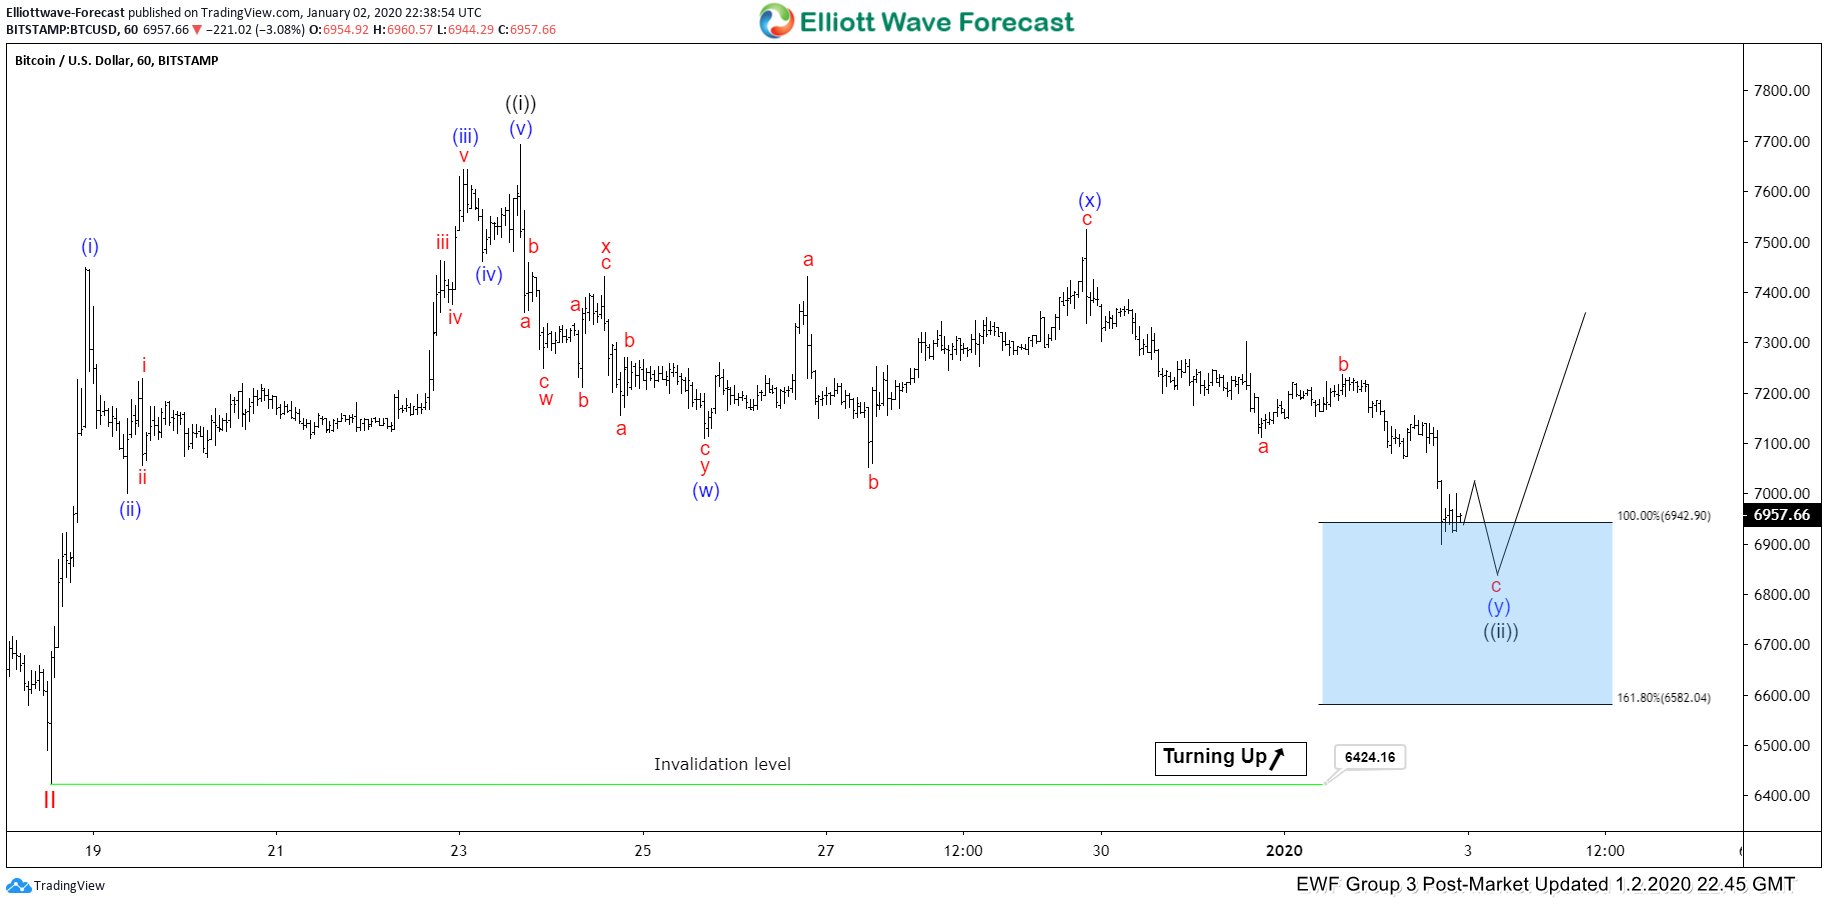
Bitcoin 1 Hour Elliott Wave Chart from 1/02/2020 Post-Market update, in which the rally from 12/18/2019 low ($6424.16) unfolded as 5 waves impulse structure where wave ((i)) ended at $7692.98 high. Down from there, the Bitcoin made a pullback in wave ((ii)). The internals of that pullback unfolded as double three structure where wave (w) ended at $7110.73 low. Wave (x) bounce ended at $7524.46 high as a lesser degree flat structure. And wave (y) was expected to end in between $6942.90-$6582.04 100%-161.8% Fibonacci extension area of (w)-(x). From where the buyers were expected to appear in the stock looking for more upside or for 3 wave reaction higher at least.
Bitcoin 1 Hour Elliott Wave Chart
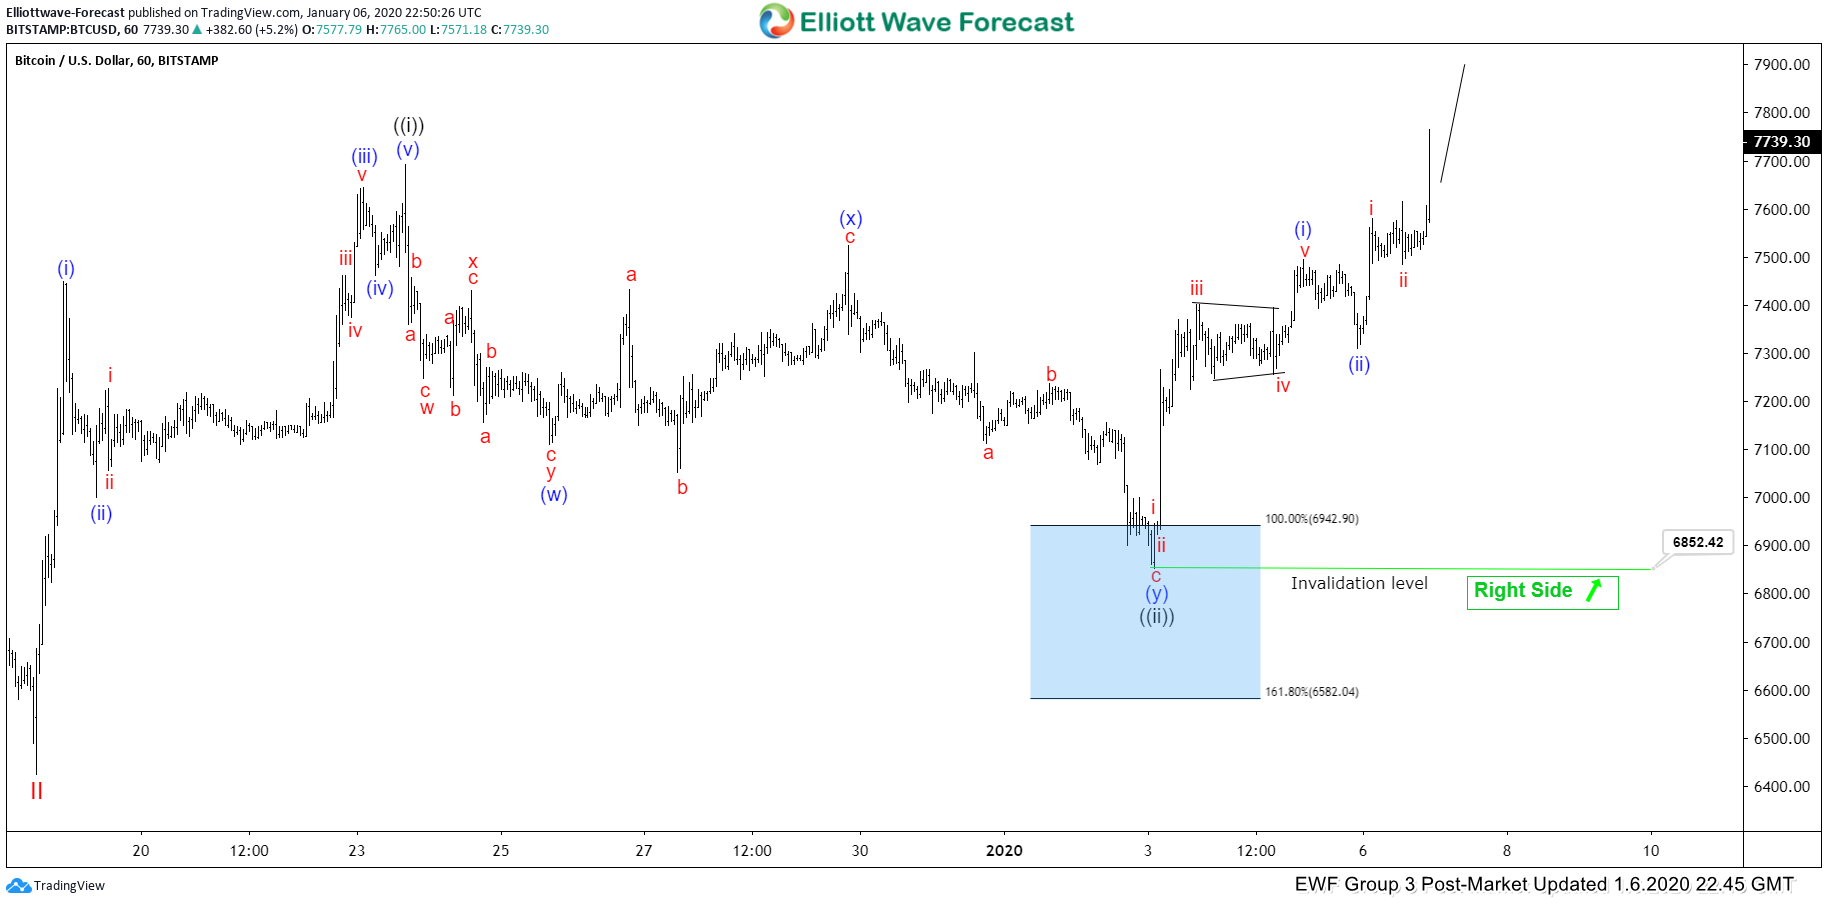
Here's Latest 1 Hour Elliott Wave Chart of Bitcoin from Post-Market update, in which the Bitcoin rallied strongly from the blue box area as expected and allowed our members to create risk-free position shortly after taking the long position from blue box area. The Bitcoin since then has managed to make a new high above $$7692.98 high suggesting that the next leg higher towards $8115.73-$8414.47 area has started. Near-term, while dips remain above $6852.42 low it should see more strength.



Comments
Log in or sign up to join the conversation.