

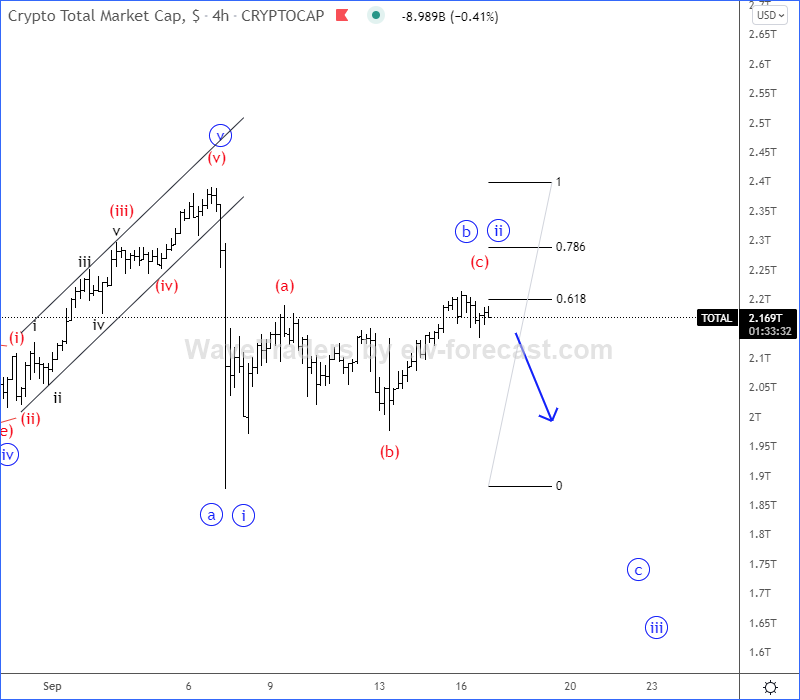
Crypto total market cap is slowing down around the projected resistance zone for wave (c) of b / ii, so be aware of a reversal down and continuation lower within wave »c« or »iii« soon, maybe already today or during the weekend.
Crypto Market Total Cap 4h Elliott Wave Analysis Chart
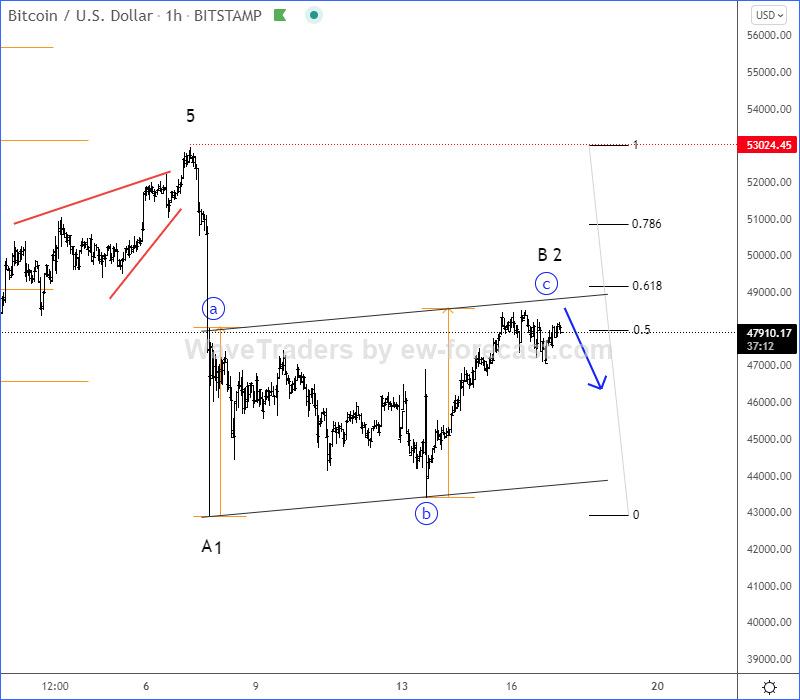
As per Elliott Wave analysis Bitcoin, BTCUSD is slowing down at the important and projected resistance zone with nice and clean a-b-c correction, where we also see equality measurement of wave a=c right at the channel resistance line and golden 61,8% Fibonacci. retracement. So, watch out for a drop and continuation lower within wave C or 3 soon.
Bitcoin 1h Elliott Wave Analysis chart
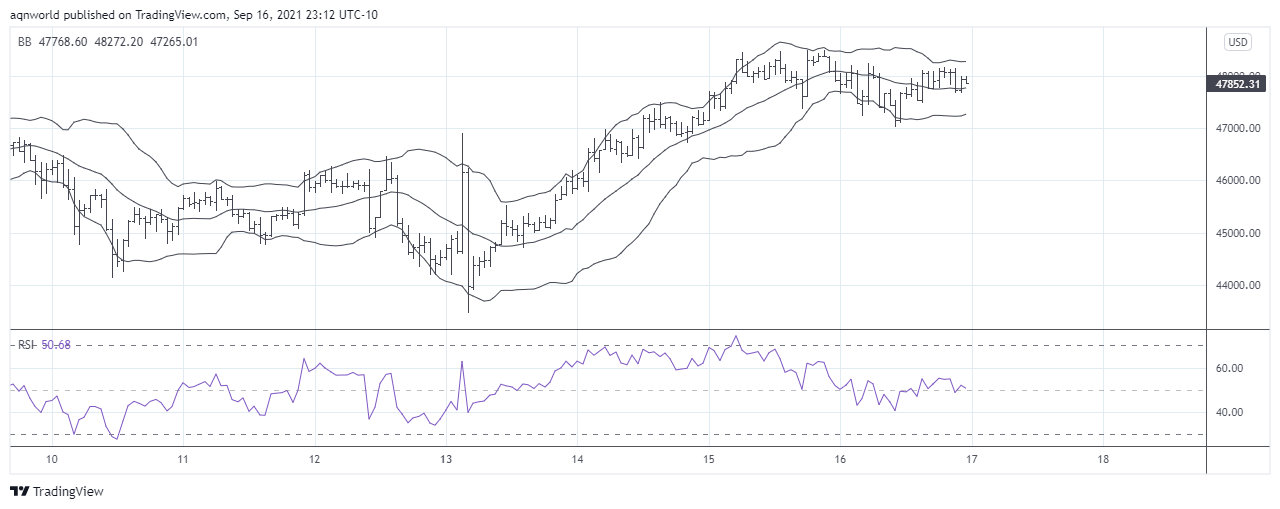
Technically Bitcoin slows down at the upper Bollinger band and RSI is hovering around 50 levels on one hour chart, looks like Bitcoin is approaching the resistance level soon after which we may see Bitcoin price sliding lower towards new lower lows.
Bitcoin 1h Chart
(Click on image to enlarge)



Comments
Log in or sign up to join the conversation.