

Image Source: Freepik
Bitcoin Cash (BCH) appears to be in the final stages of a higher-degree A-B-C irregular flat correction, labeled as wave (2) on the daily chart. Price recently tested a strong support zone and responded with a sharp rebound, suggesting that corrective pressure may be fading and that wave (2) could already be complete.
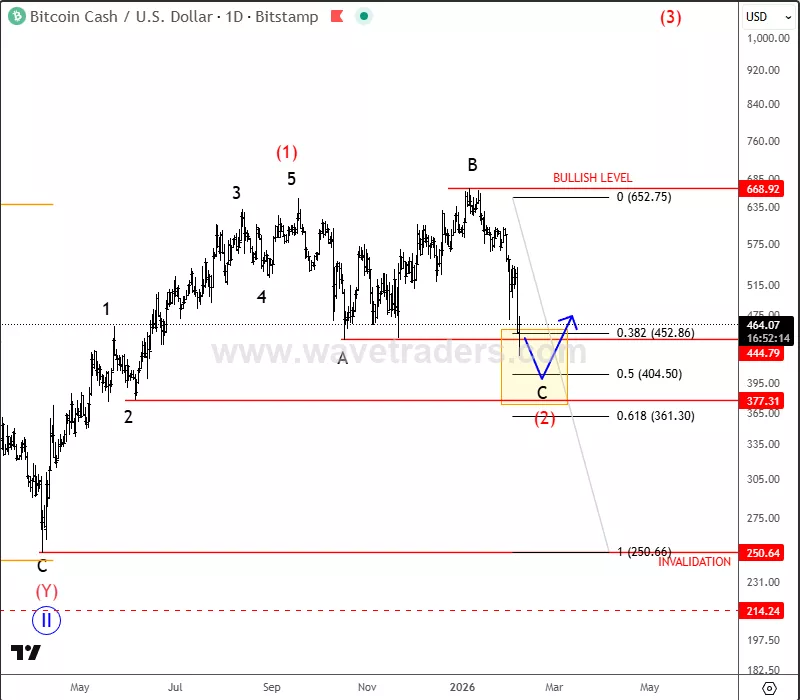
BCHUSD Daily Chart
On the 4-hour chart, BCH seems to have completed a five-wave bearish impulse within wave C of the correction. This type of structure often signals downside exhaustion, increasing the probability that a meaningful support level is now in place. A recovery and hold above the 563 level would further strengthen this bullish case.
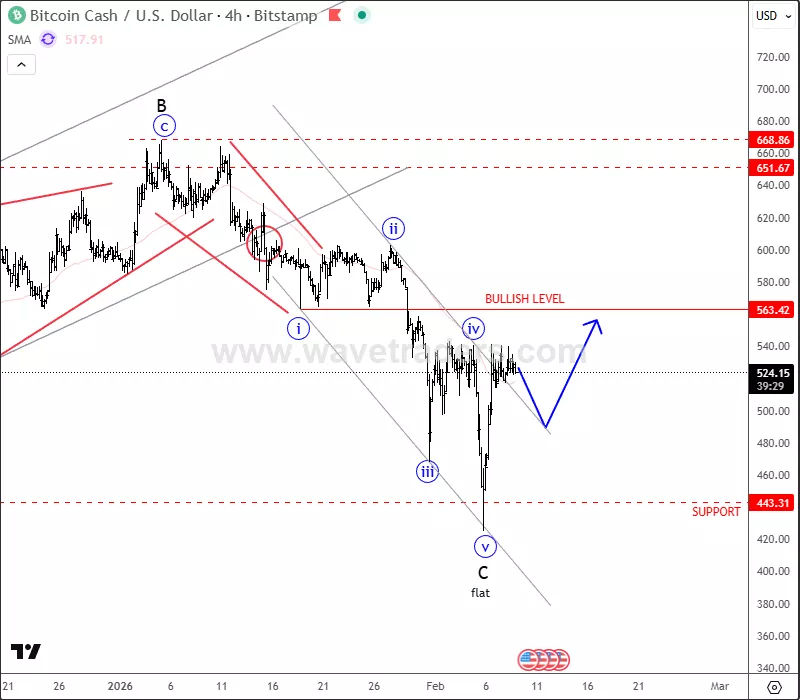
BCHUSD 4H Chart
For now, however, the recovery is best viewed as a minimum three-wave move, as bullish momentum has not yet been fully confirmed. From a technical perspective, a clear break and acceptance above the 670 area would be required to confirm a broader trend reversal rather than a temporary corrective bounce.
Key Levels to Watch
- Support: Recent wave C lows
- Initial confirmation: Above 563
- Bullish confirmation: Above 670
Until price reclaims the upper resistance zone, BCH may continue to consolidate or recover in a corrective manner. Still, the completed wave structure and sharp rebound from support suggest that downside risk is increasingly limited, making this area technically important for upcoming price action.
For more analysis like this, you may want to join our live webinar today, Monday February 09, 2026: DIRECT LINK
More By This Author:
Bitcoin Market Update: The October 2025 Top And The Road Through Wave IV
AMD Faces Sharp Downturn After Disappointing Q1 Outlook
McDonald’s Rally Continues; Final Wave In Motion?


Comments
Log in or sign up to join the conversation.