
Today was a significant day in the “Big Trade” so here is a quick review from a chart perspective. The Big Trade is a long term trade based on the US economy entering recession by the end of the year. The energy complex will likely reflect a decline in price if such recession does occur.
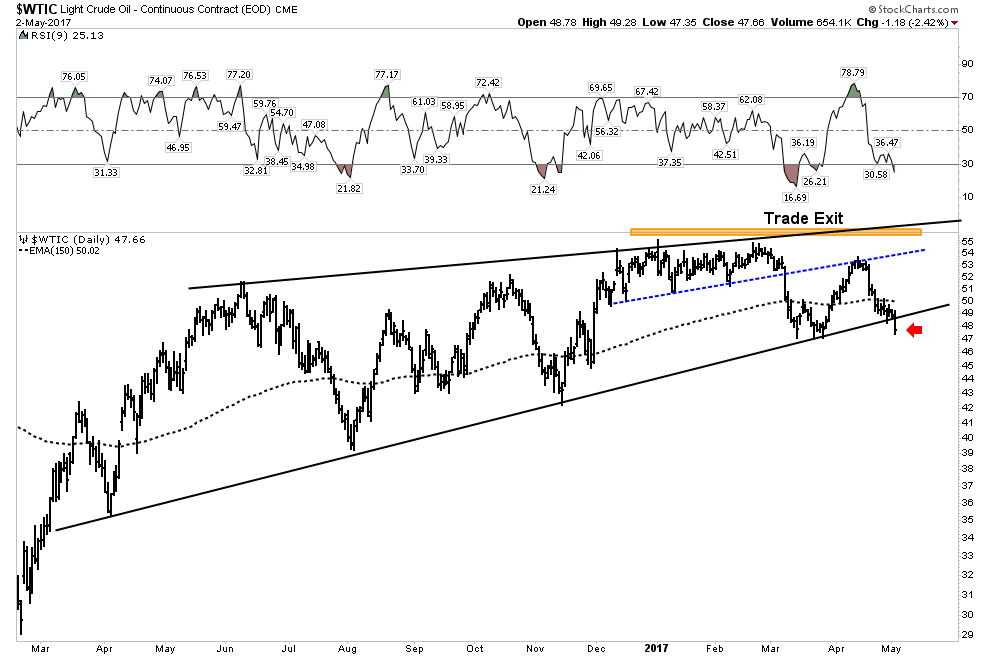
Crude Oil- significant break of support.
After 7 previous tests of the rising wedge support line it gave way today. Note also the 30 W EMA is just now starting to bend downward. RSI is NOT oversold so it therefore should not break the move. This is a significant development and tilts the probabilities towards a further fall. Price could drop from here, however more likely IMO we will enter a BT phase, maybe lasting until the upcoming OPEC meeting on May 25th.
(Click on image to enlarge)
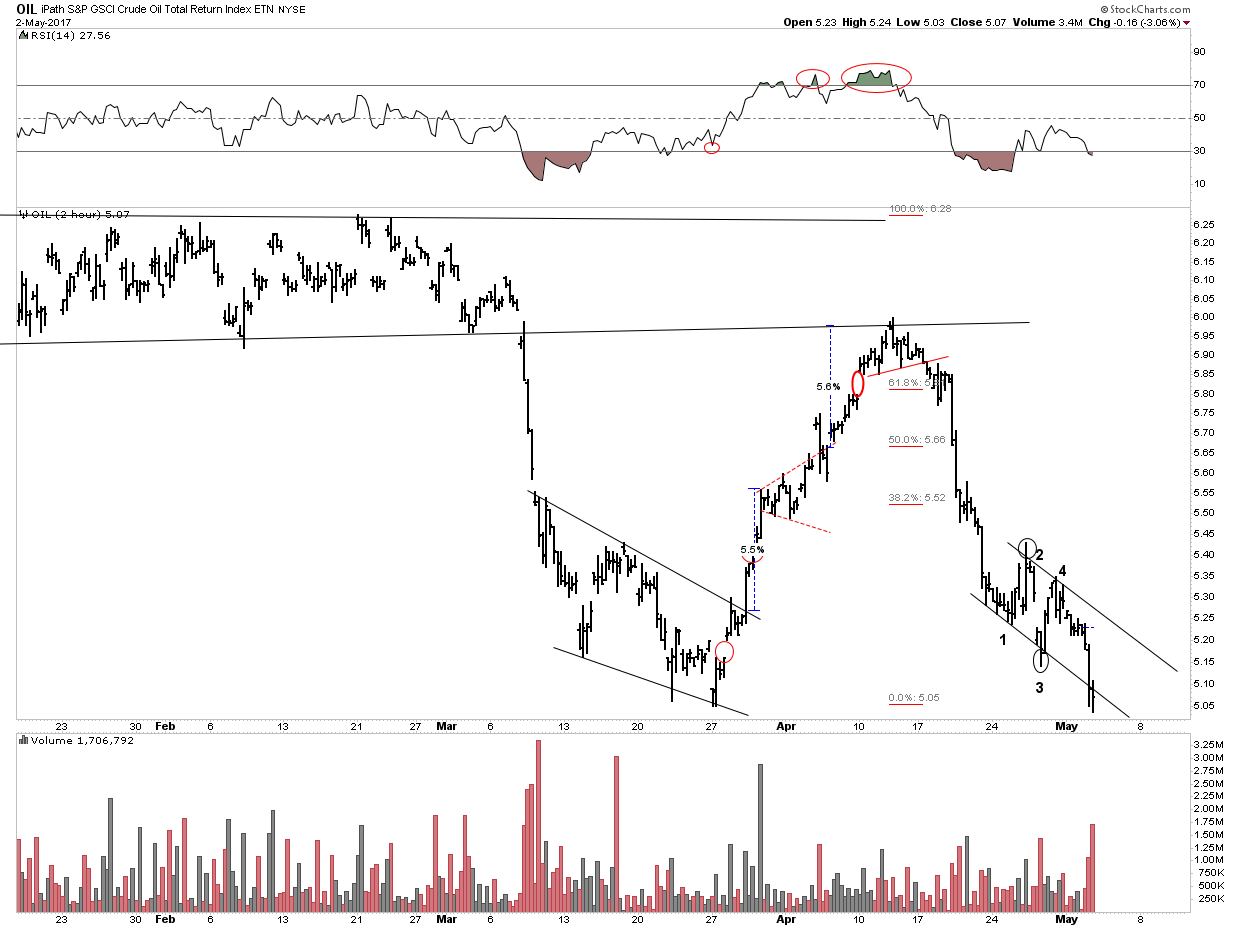
Breaking the channel in a 4 pt continuation move?
(Click on image to enlarge)
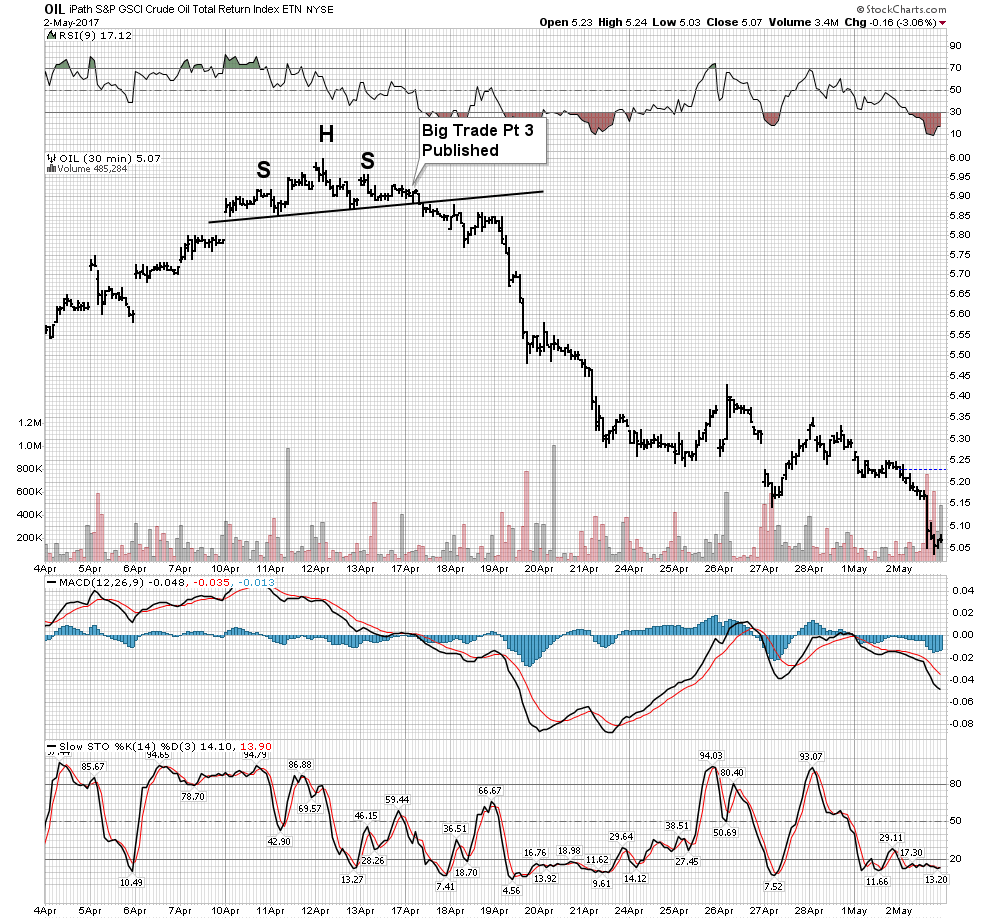
Breakdown Action- note today’s volume.
(Click on image to enlarge)
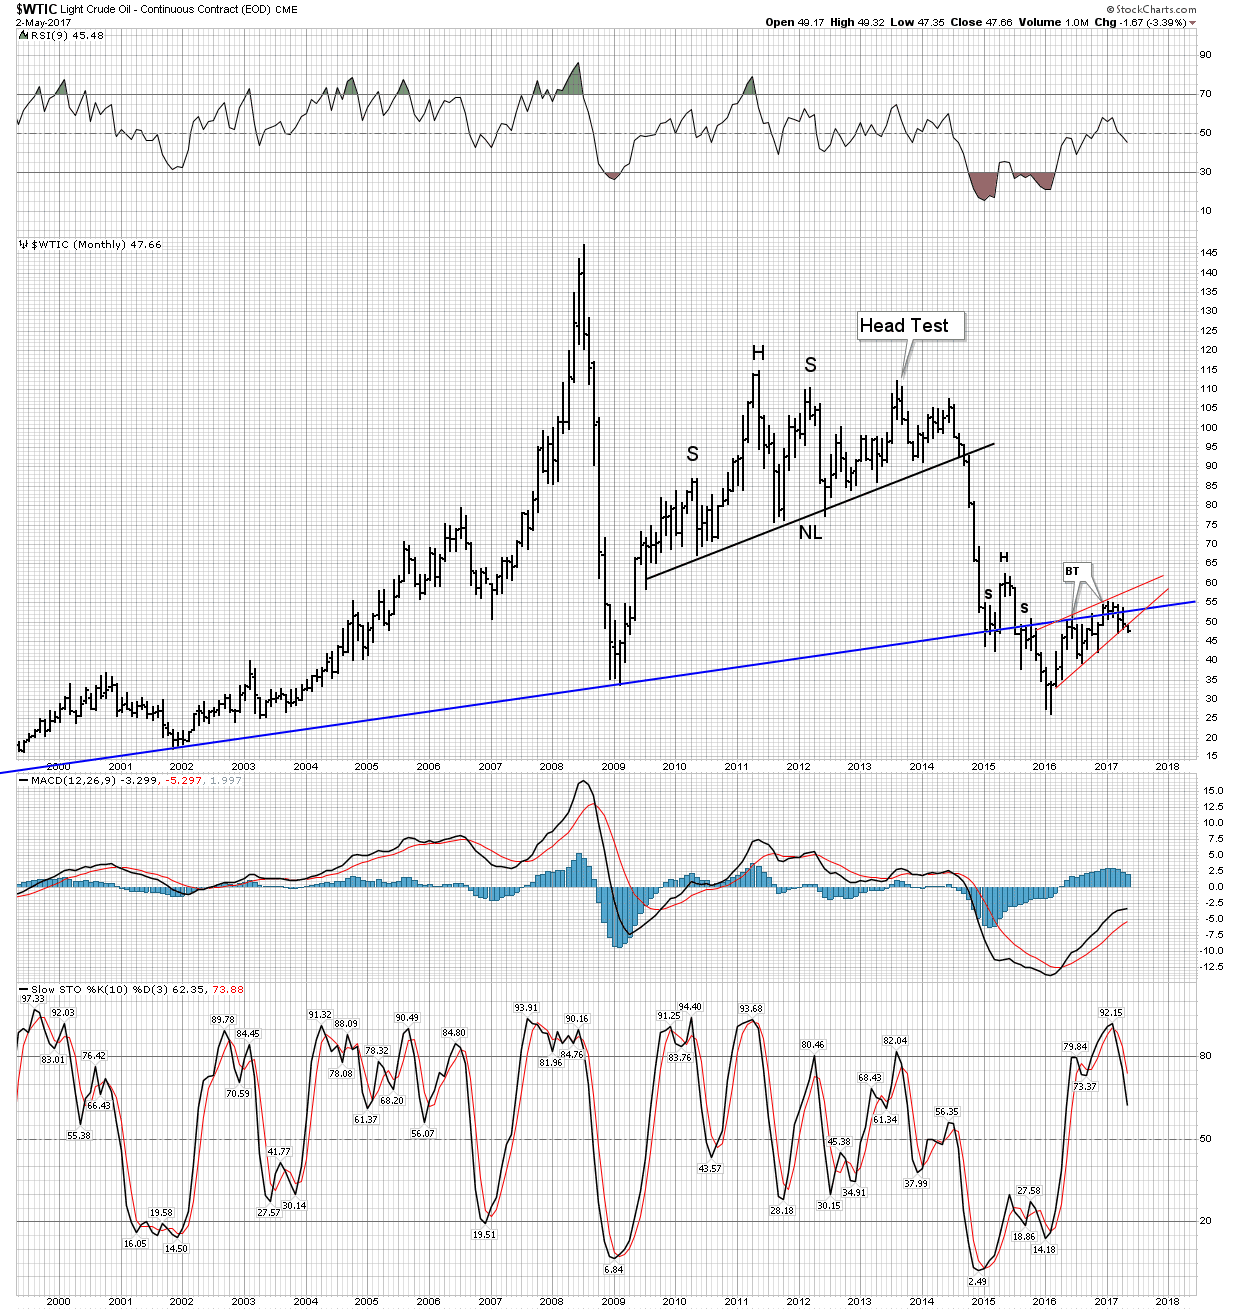
Oils Big Picture-
Recall Rambus’ principle of significant technical patterns building themselves out above and below important lines of support and resistance. Typically the second pattern wins out, but in this case they are both bearish! So this is Uber Bearish. H&S and Rising wedge. Also note stochastics now in a full-on negative configuration. Today’s action for the first time dips below the rising wedge support boundary—Whoops!
(Click on image to enlarge)
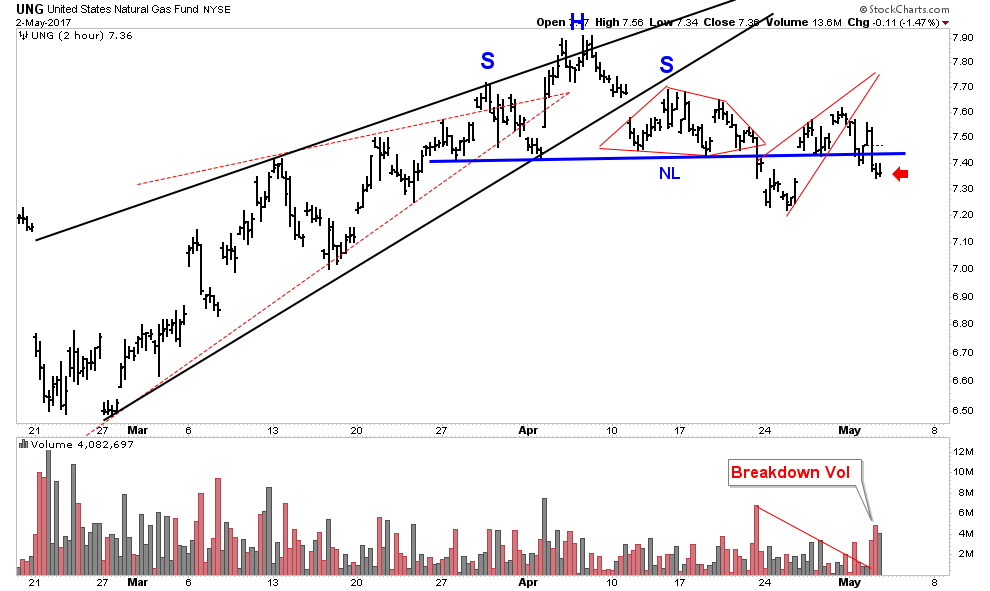
The Other Energy Complex- NATGAS
Significant happenings here as well knights. Note the rising wedge resolving into a breakdown and then busting the NL. So at this point it appears we had an aggressive BT with a bull trap above the NL. I also refer to this as a head test. Typical before a breakdown price breaks upward which cleans out the shorts before a drop. We will see what tomorrow brings in this volatile sector, but so far its all been classic chartology.
(Click on image to enlarge)
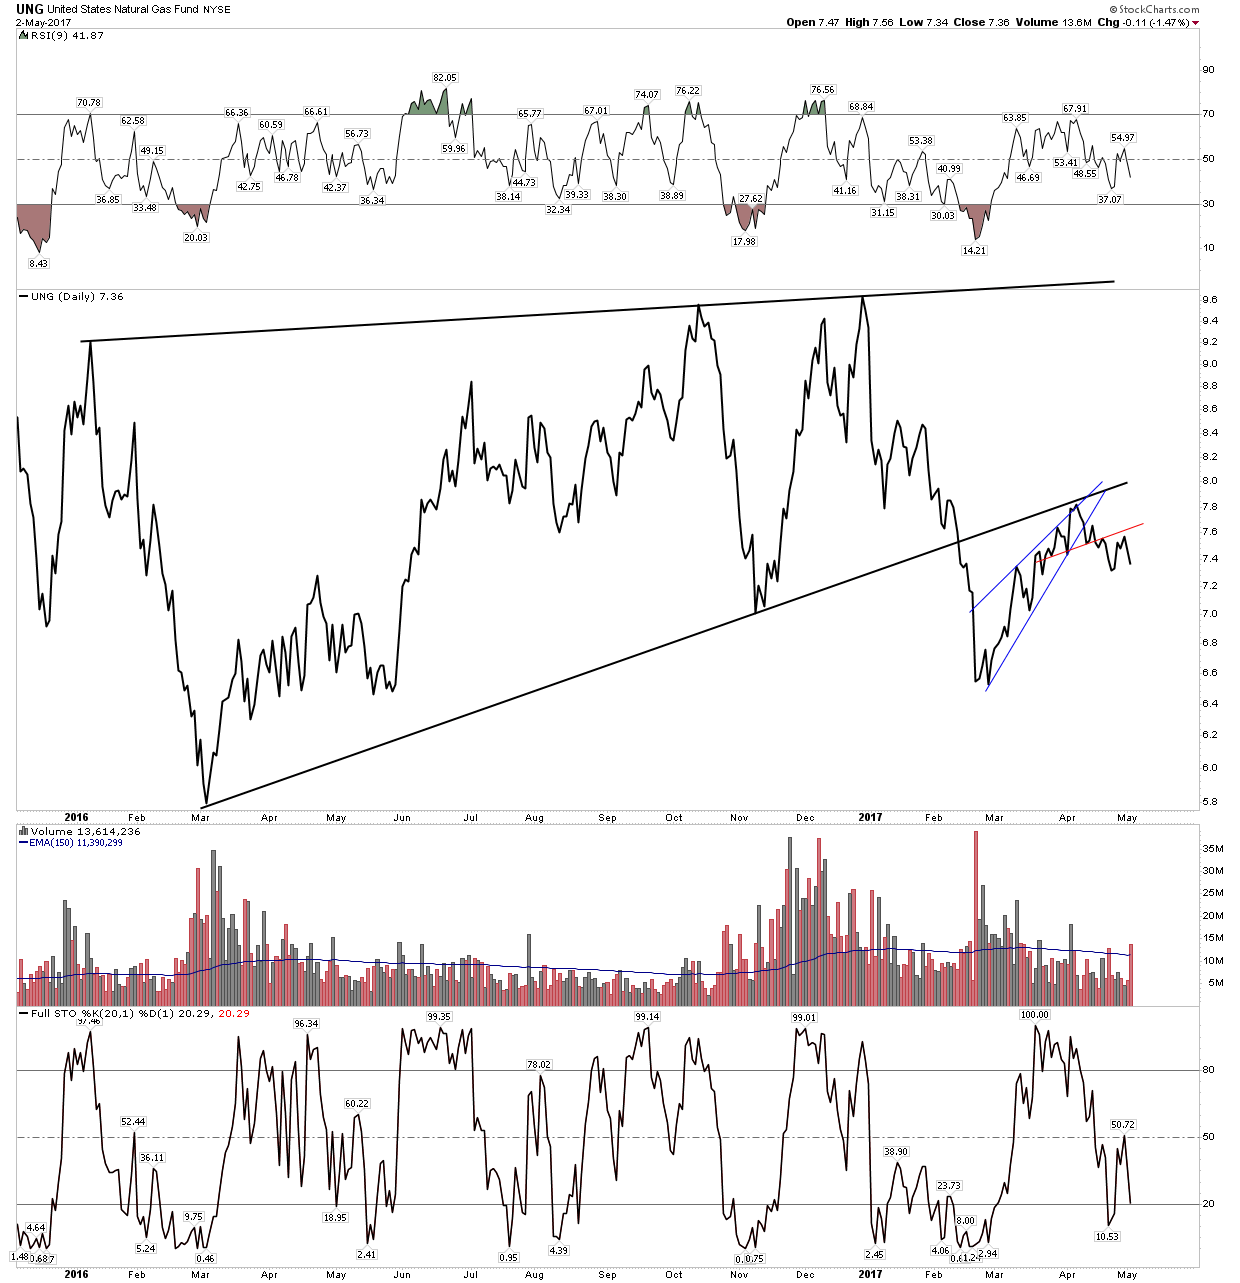
Pretty Classic:
(Click on image to enlarge)
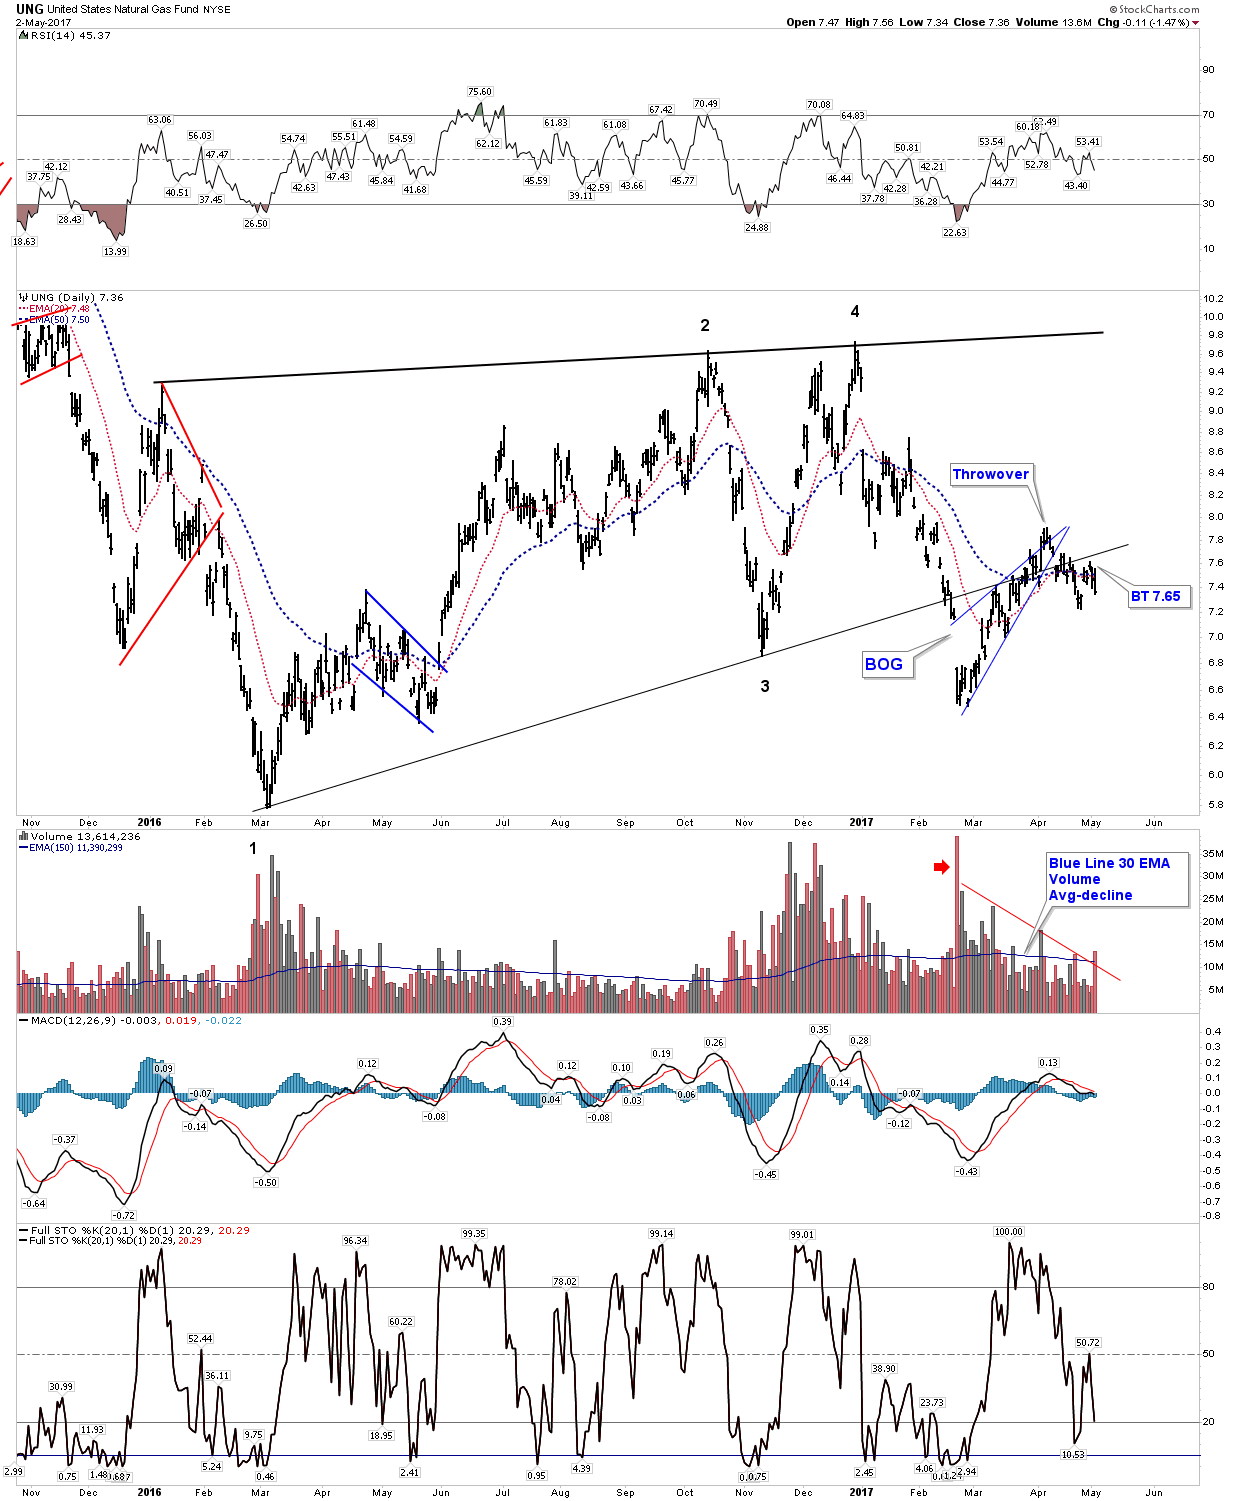
The Bar Chart- note the volume
(Click on image to enlarge)
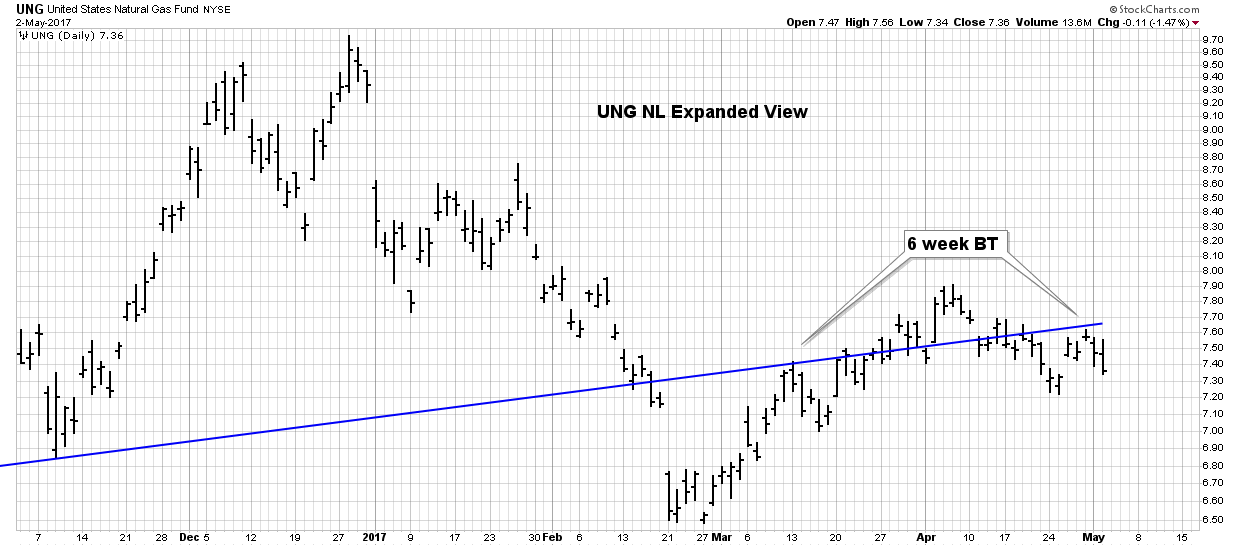
Closeup of the Back Test process- 6 weeks
(Click on image to enlarge)
So these charts offer a view of another brick in the wall, as Rambus would say. Price can always reverse from any level, but these charts show the process that has been occurring and depict the increase of probabilities that our investment thesis is correct.


Comments
Log in or sign up to join the conversation.