

There’s an old saying among traders that “no stock market rally will continue without participation from the financials”. This makes sense intrinsically because banks provide the liquidity from which the economy operates.
Early last October one of the indications to me that the stock market might be in trouble was the failed breakout above $28 for the XLF ETF. Back then we had failed breakouts in other sectors as well like technology and cannabis, and these indicated the market was setting up for a correction.
The failed breakout in XLF was also combined with the fact that XLF had been underperforming the S&P 500 all year in 2018. That’s just not a recipe for a strong stock market. The problem right now is XLF is still under-performing and just had a major breakdown last week with a big bearish engulfing weekly candlestick.
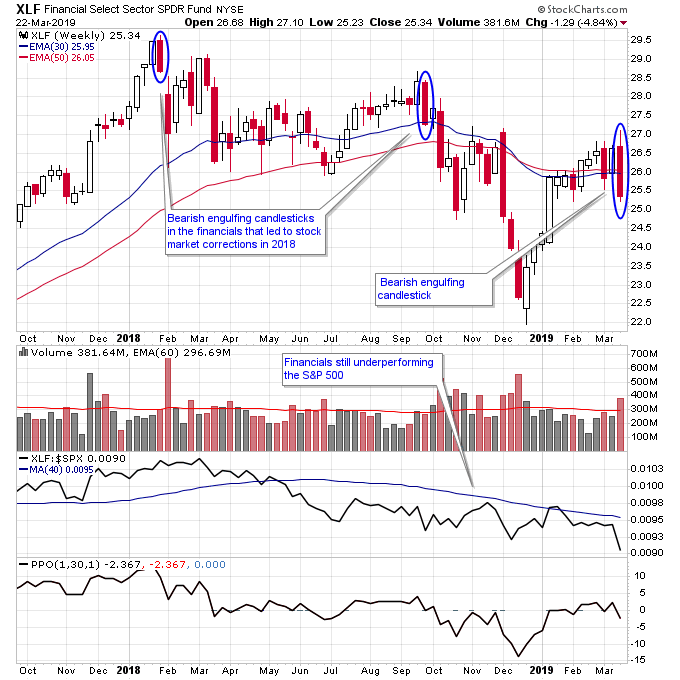
On the bullish side of things, it’s undeniable that we’ve seen an explosive start to the year in software, semiconductors, cannabis, and Chinese stocks to name a few leading sectors. But many of these stocks are now stretched too far above their 30-week moving average to provide good entry points. Since they need to correct, and the financials are under pressure, it’s clear that the market is likely to remain under pressure for the near term.
The S&P 500 has plenty of room to correct down to the 2600 level and still hold support and be in Stage 1. If it breaks that level we could get a Stage 4 downtrend. But if we remain in Stage 1 and consolidate between 2600-2850 the market will build a bigger base for the Stage 2 uptrend to resume. What will be key to watch is how leading stocks continue to act, if they hold up well then it’s more likely the S&P 500 will eventually join them moving higher.
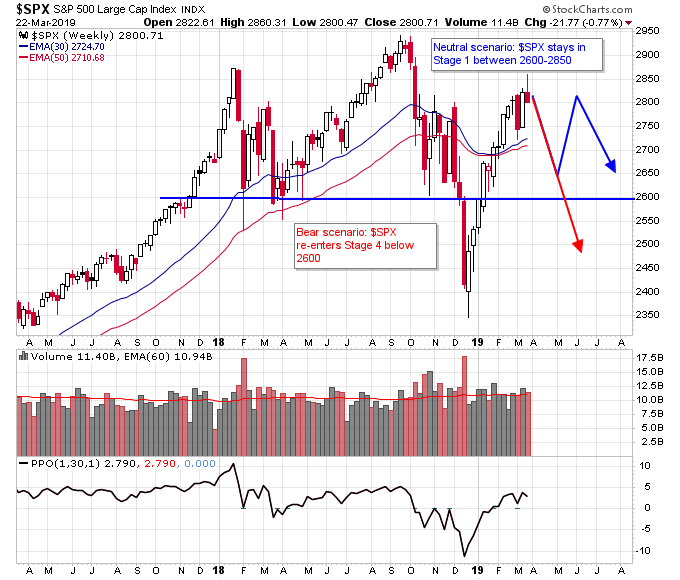
Sideways is one of three possible directions for the market to move and in the chart above I call this the “neutral scenario” where the S&P 500 continues to chop for a while between 2600-2850.


Comments
Log in or sign up to join the conversation.