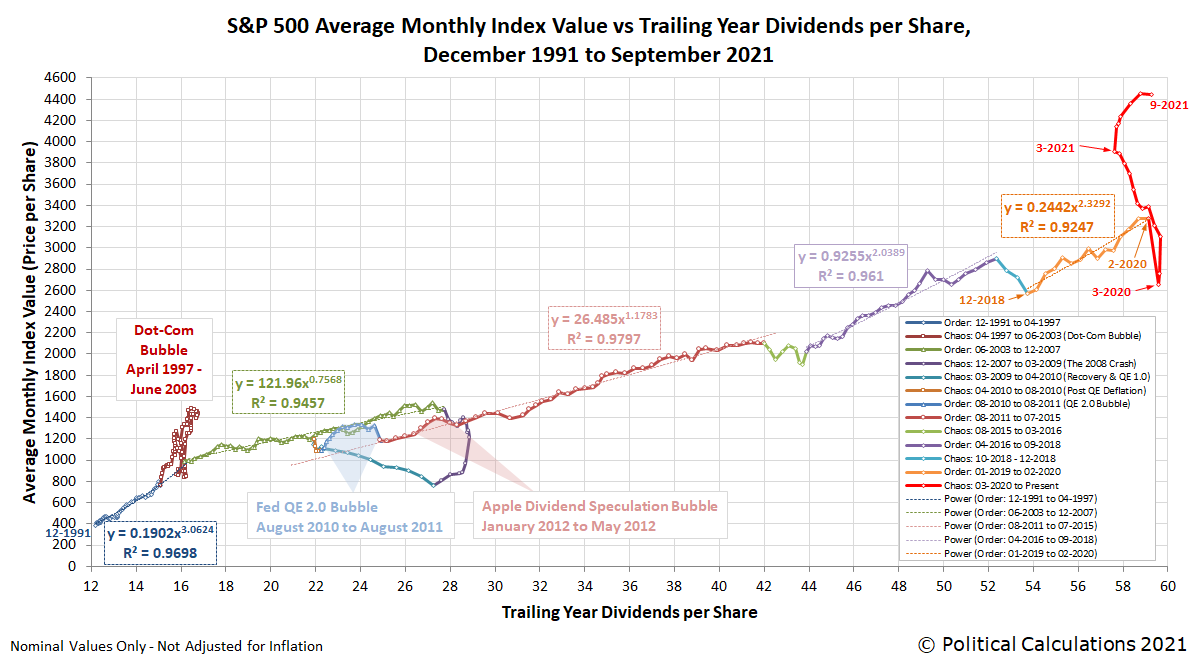
We've updated our chart tracking the periods of order and chaos that have characterized the S&P 500 (Index: SPX) over the past 30 years.
We've updated our chart tracking the periods of order and chaos that have characterized the S&P 500 (Index: SPX) over the past 30 years.
(Click on image to enlarge)
It won't be a surprise, but the index entered into a period of chaos with the arrival of the coronavirus pandemic in March 2020. Through eighteen full months later, the index is still characterized by chaos.
The big question: Is the U.S. stock market in an economic bubble?
If you want to know where we stand on the question, we wrote the definition of an economic bubble.
Disclaimer:
Materials that are published by Political Calculations can provide visitors with free information and insights regarding the incentives created by the laws and policies described. However, this article is not designed for the purpose of providing legal, medical or financial advice to individuals. Visitors should not rely upon information on this website as a substitute for personal legal, medical or financial advice. While we make every effort to provide accurate article information, laws can change and inaccuracies happen despite our best efforts. If you have an individual problem, you should seek advice from a licensed professional in your state, i.e., by a competent authority with specialized knowledge who can apply it to the particular circumstances of your case.


Comments
Log in or sign up to join the conversation.