

Video Length: 00:05:15
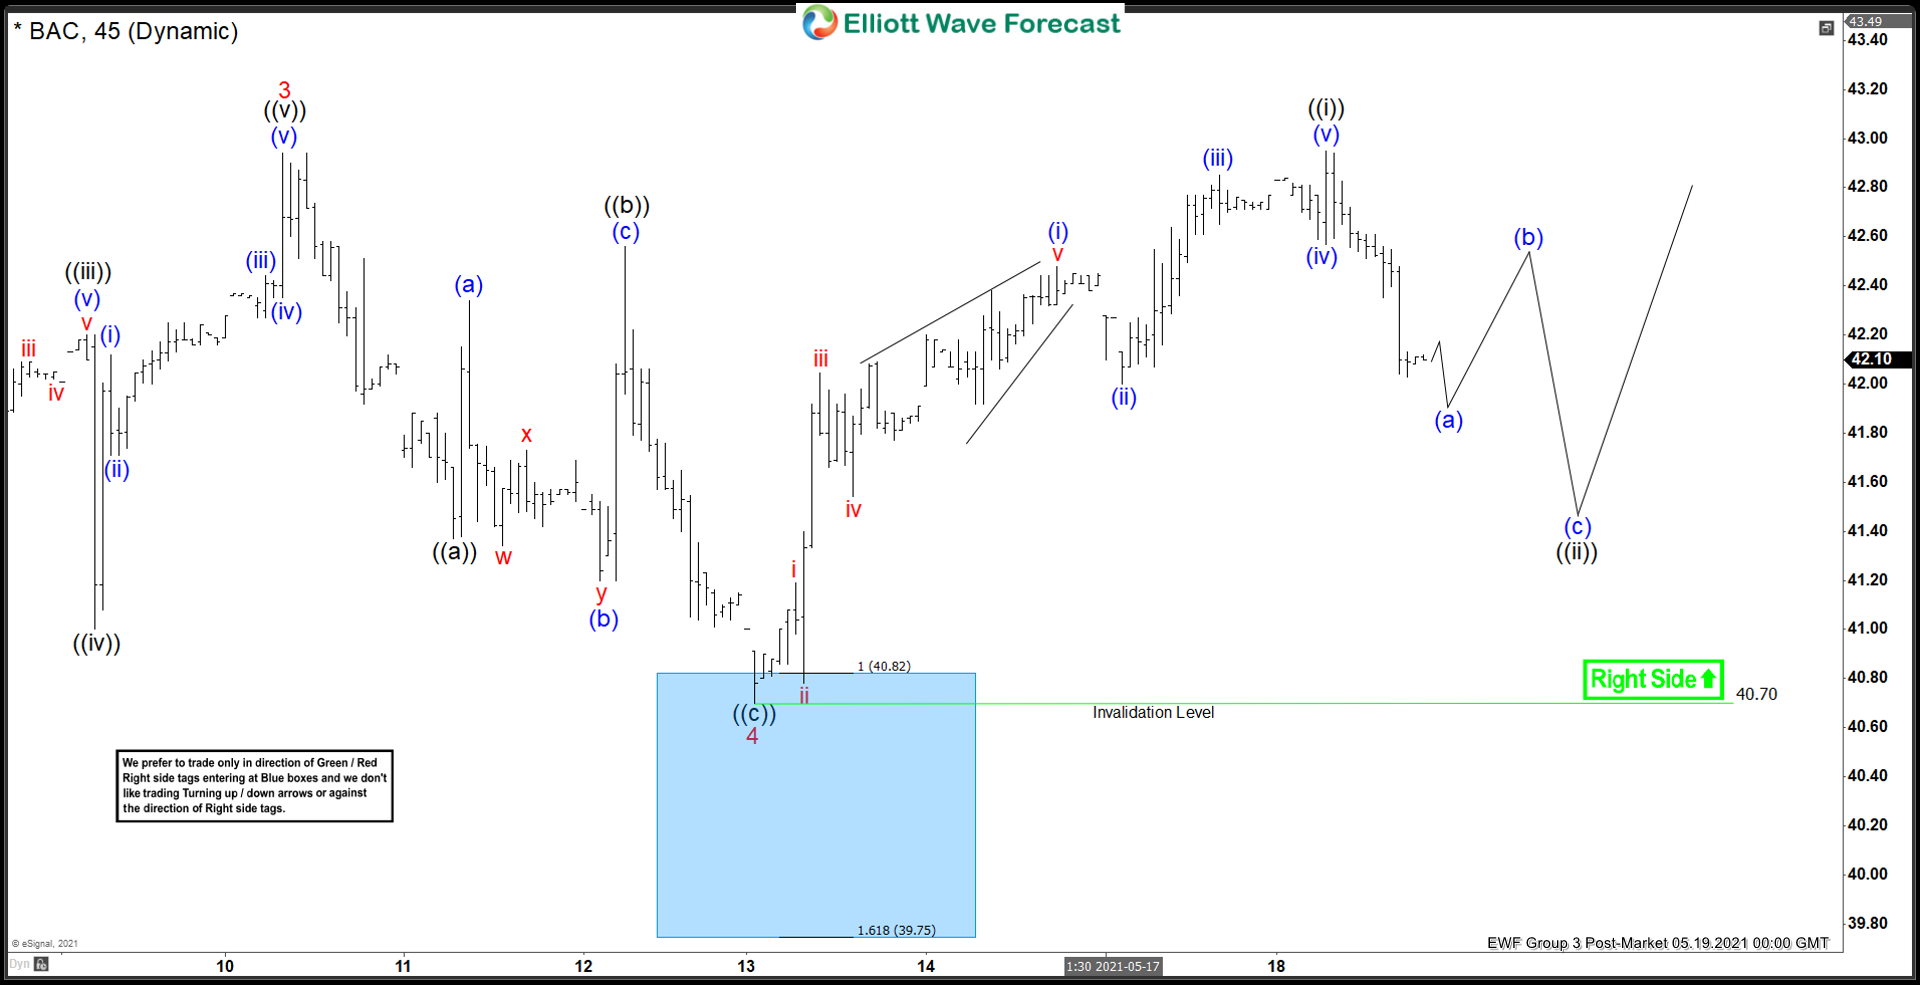
Bank of America (BAC) has just made a 12 year high and structure from February 1, 2021, which suggests the rally is unfolding as a 5 waves impulsive Elliott Wave structure. Up from February 1, wave 1 ended at 39.97, and wave 2 pullbacks ended at 36.63. The stock rallies higher again and ended wave 3 at 42.94 as the 45 minutes chart below shows. The pullback in wave 4 completed at 40.78.
Internal subdivision of wave 4 unfolded as a zigzag Elliott Wave structure. Down from wave 3, wave ((a)) ended at 41.37, and bounce in wave ((b)) ended at 42.56. The last leg lower wave ((c)) of 4 has completed at 40.70. From there, the stock has resumed higher in wave 5. BAC has broken above wave 3 at 42.94 suggesting the next leg higher has started. Up from wave 4, wave (i) ended at 42.48, and a pullback in wave (ii) ended at 42. Wave (iii) ended at 42.85, wave (iv) ended at 42.57, and wave (v) ended at 42.95. This should complete wave ((i)) of 5 to a higher degree.
Wave ((ii)) pullback is now in progress to correct the cycle from May 13 low before the rally resumes. As far as May 13 low pivot at 40.70 remains intact, expect dips to find support in 3, 7, 11 swing for more upside.
Bank of America (BAC) 45 Minutes Elliott Wave Chart
(Click on image to enlarge)


Comments
Log in or sign up to join the conversation.