


AXP shows solid performance within its long‑term bullish cycle, yet the price now signals early exhaustion. The stock held its impulsive structure through most of the year; however, it approaches a zone where markets usually decide between further extension or a deeper corrective phase. This moment matters because it blends key technical levels with a clear shift in momentum.
Meanwhile, American Express enters this stage with stable fundamentals. The company benefits from strong premium‑consumer spending, growing corporate card demand, and lower delinquency rates than most financial peers. Even so, rising rates, slower travel activity, and softer discretionary consumption create pressure that could limit its pace over the next three months. As a result, the balance between operational strength and macro risks suggests a possible consolidation while the market tests the resilience of its business model.
Elliott Wave Outlook: AXP Weekly Chart June 20th, 2026
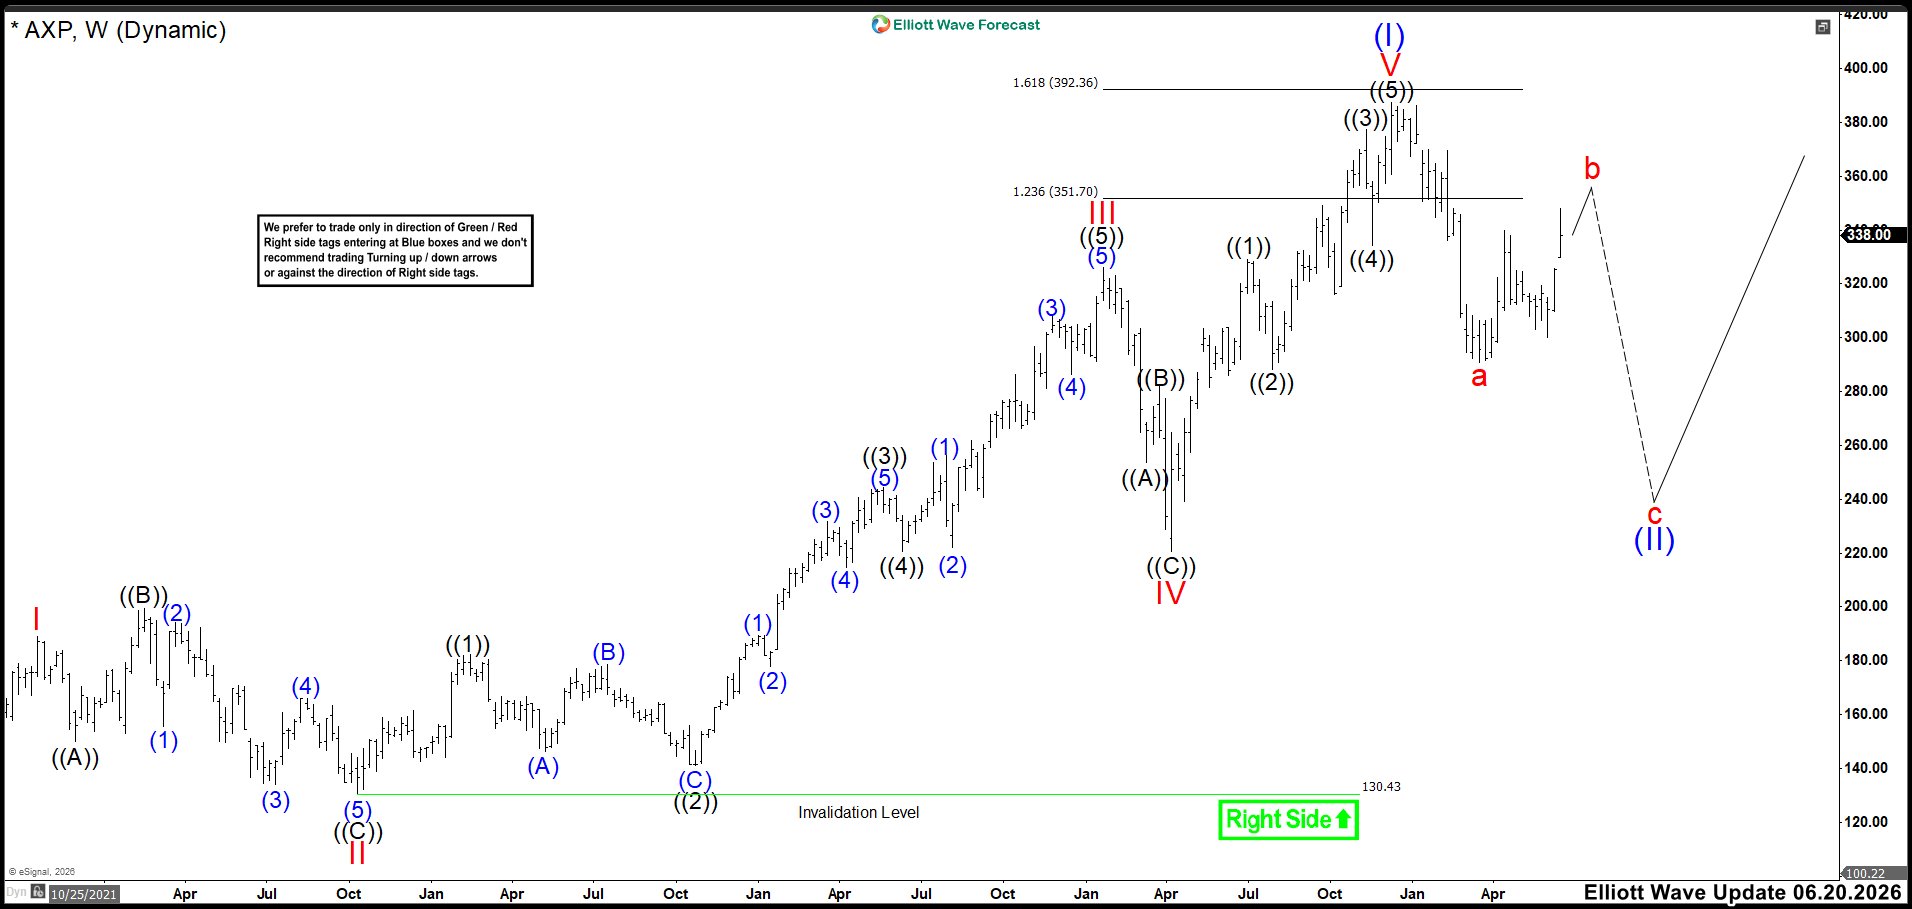
In June, we believed AXP had already completed wave (I) and started the larger wave (II) correction. The first decline formed wave a, while price was developing a corrective recovery in wave b. Therefore, we expected wave b to complete before sellers regained control. At that time, the structure still allowed another push toward the 350–360 area.
Once wave b finished, we expected AXP to turn lower and continue wave c of (II). Consequently, our focus remained on a deeper corrective decline rather than renewed long-term strength. We projected wave c to eventually reach the 200–250 region. From there, we expected wave (II) to complete and the next major bullish cycle to begin.
Elliott Wave Principle Behind the Market Structure
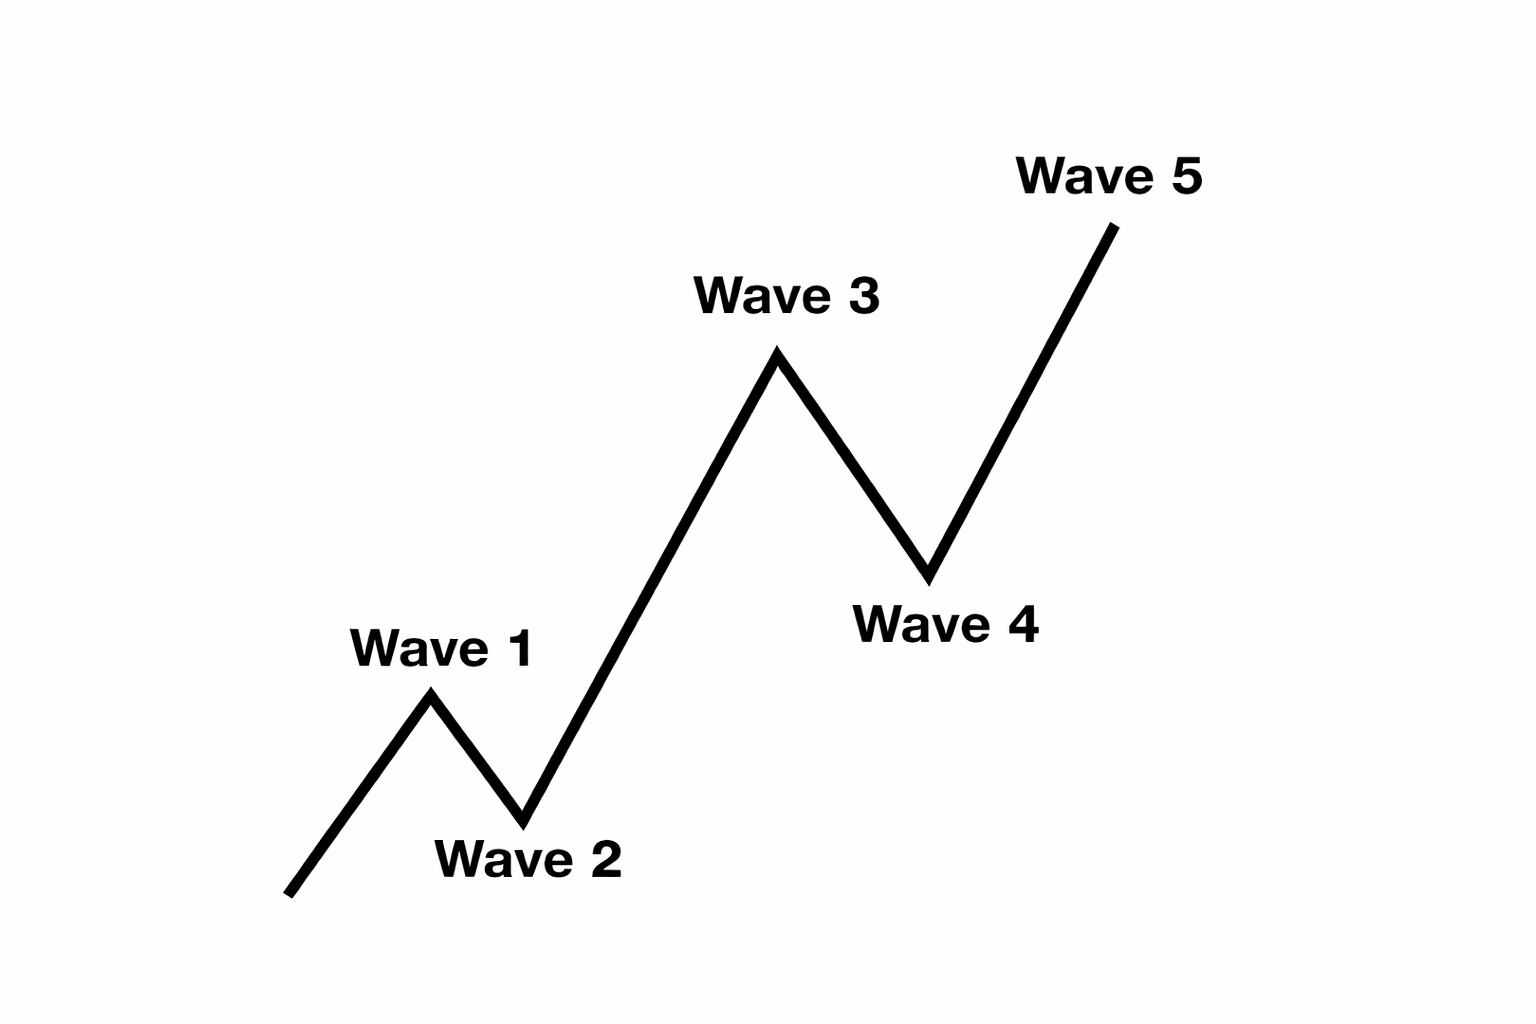
Impulse
An impulse is a clean 5‑wave pattern that drives the trend forward.
Waves 1‑3‑5 are strong and directional.
No overlap between waves 1 and 4.
Wave 3 is usually the strongest.
Structure is clear, with increasing momentum
Elliott Wave Outlook: AXP Weekly Chart September 05th, 2026
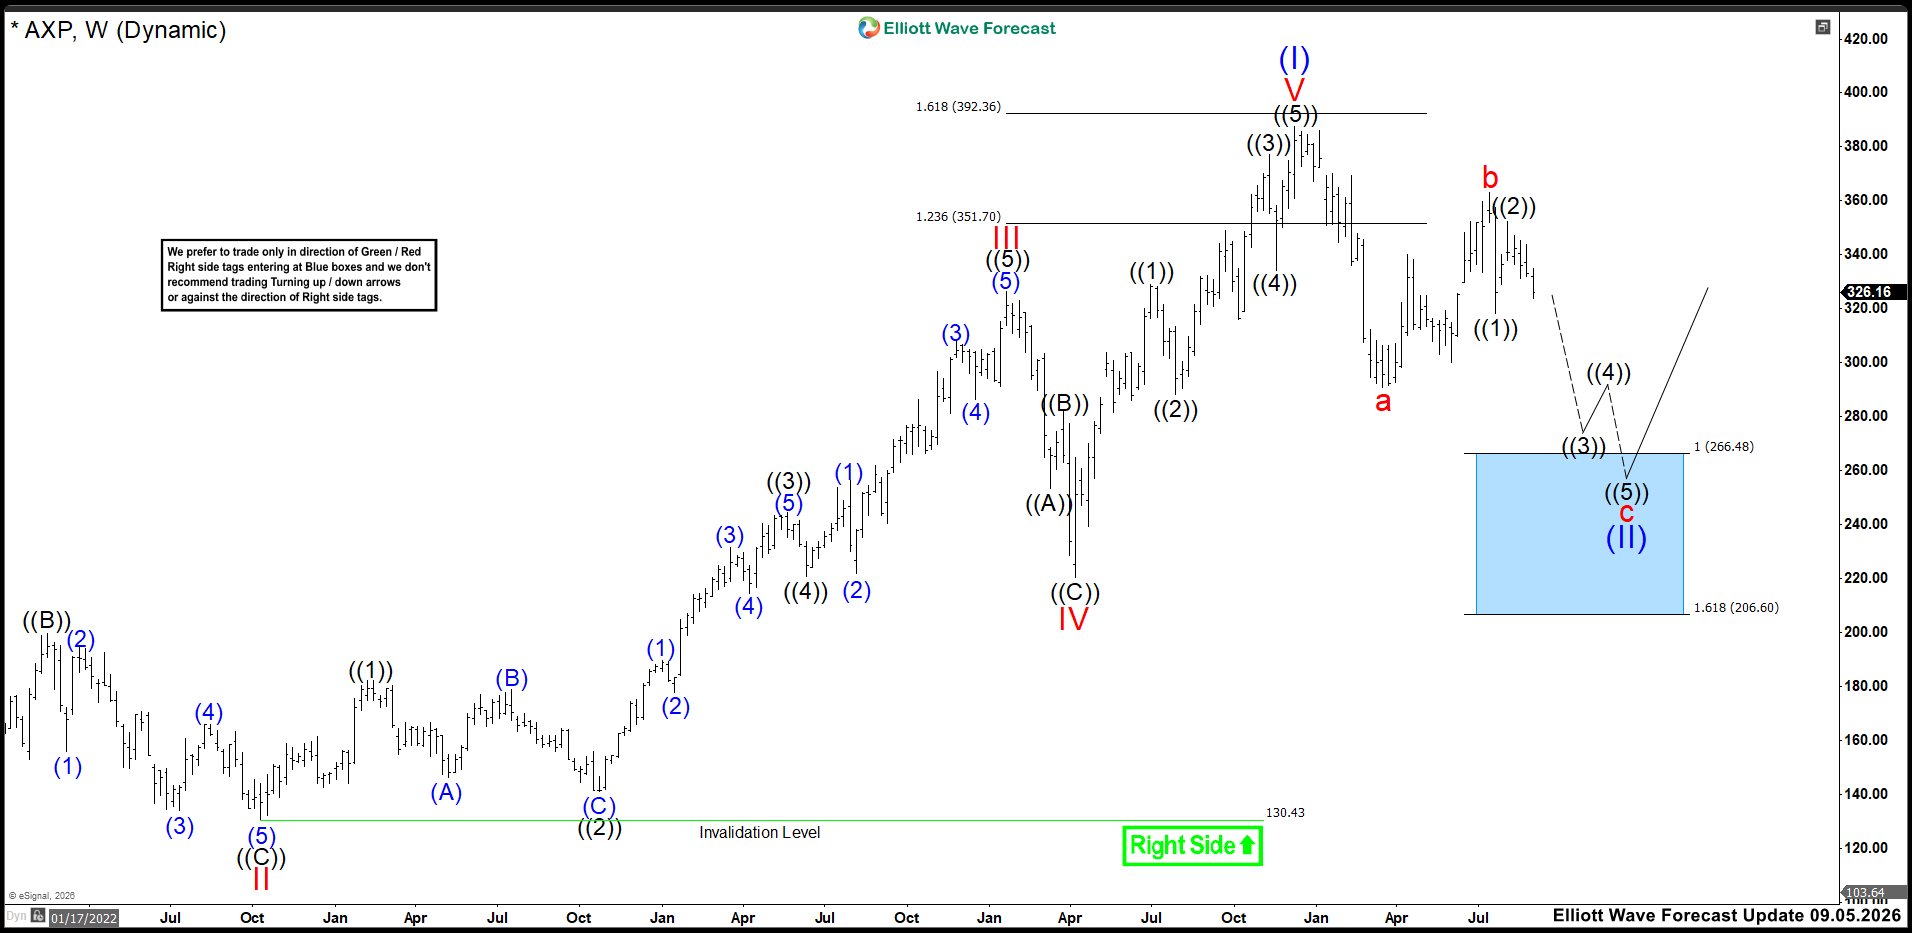
American Express (AXP) appears to have completed major wave (I) at 387.49. That advance developed from the October 2022 low and produced a clear bullish sequence. After reaching 387.49, AXP started a larger corrective phase in wave (II). The first leg lower formed wave a, while the rebound completed wave b at 363.14. Therefore, the chart now favors another decline in wave c. This move should unfold in five waves before completing the larger correction.
The main downside target remains the 266.48–206.60 Blue Box. This area represents the preferred zone for wave (II) to finish. However, the larger trend still favors the upside while price stays above 130.43. Consequently, we view the decline as a correction within a broader bullish cycle. Buyers should appear from the Blue Box and start the next major advance. Ultimately, that rally should break above the wave (I) high at 387.49 and extend the larger bullish sequence.



Comments
Log in or sign up to join the conversation.